The kldload web UI — a tour.
A walk through the kldload web UI — section by section, with what each one actually does and why it matters. Click any frame for full resolution.
Dashboard
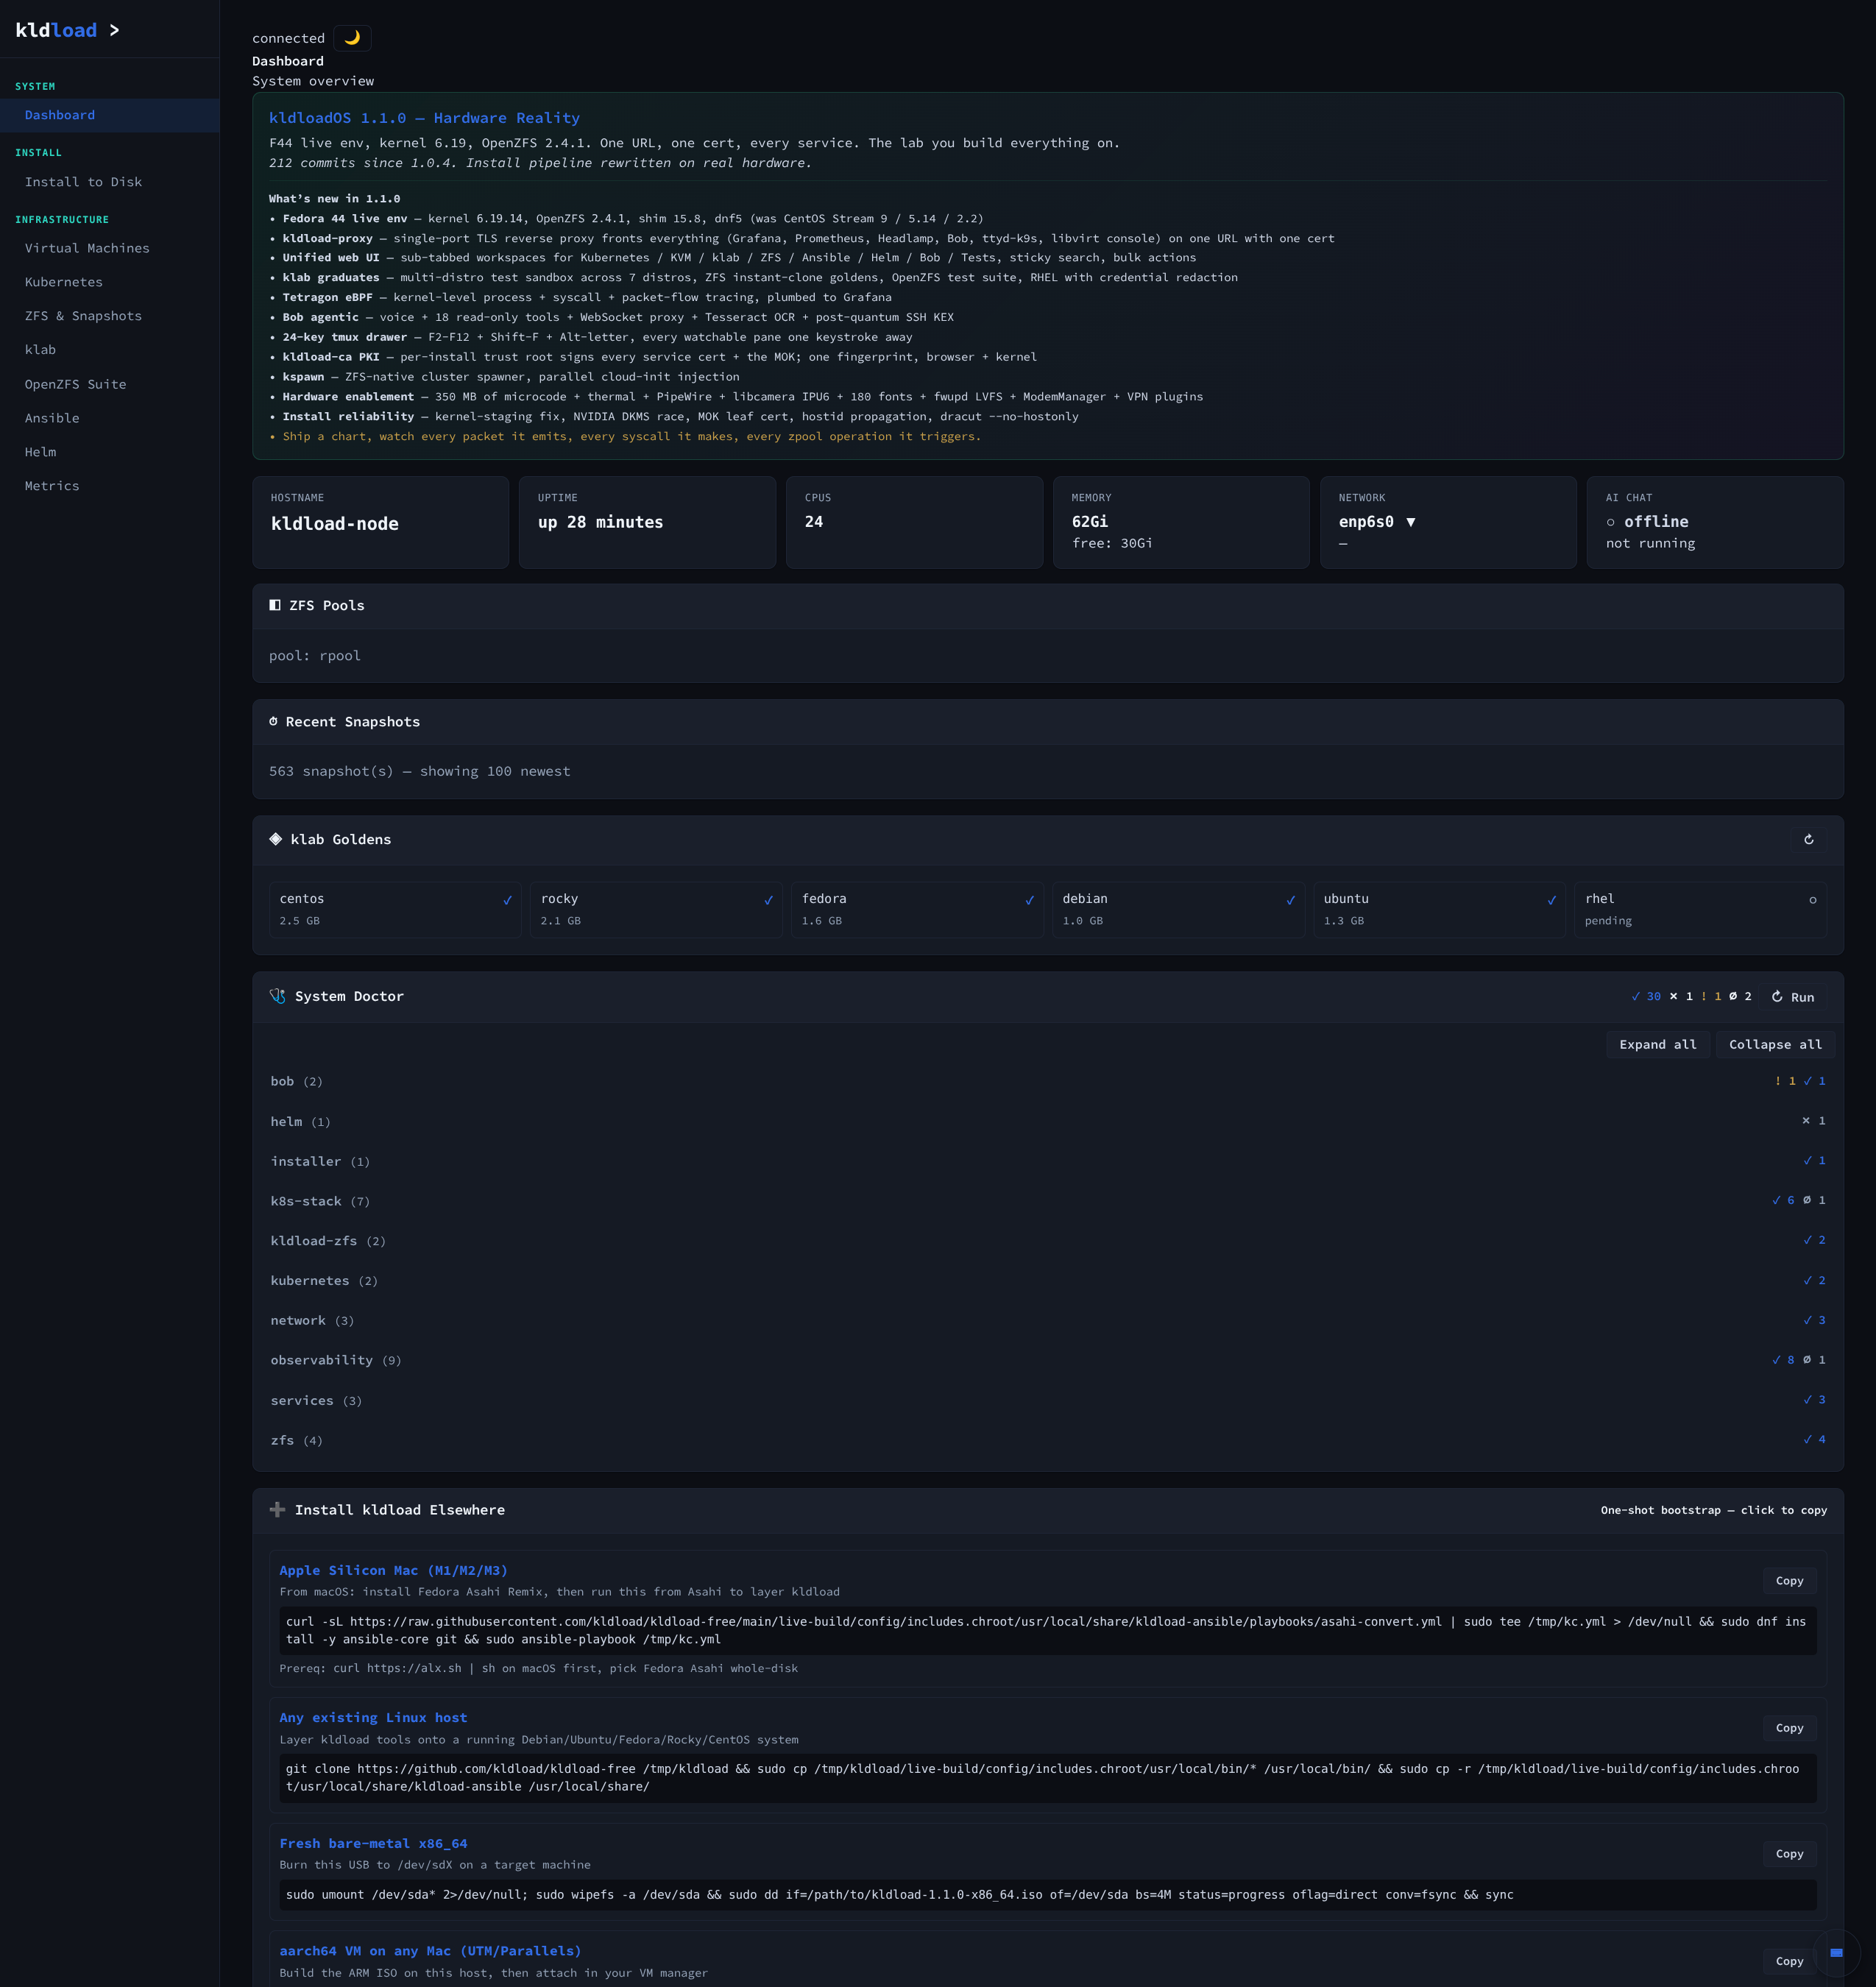
The view that loads the moment you connect — every dashboard you see on the rest of this page was already collecting data when you walked up to the box. No agent install, no “wait 5 minutes for telemetry,” no signup. The system narrates its own boot.
System Doctor
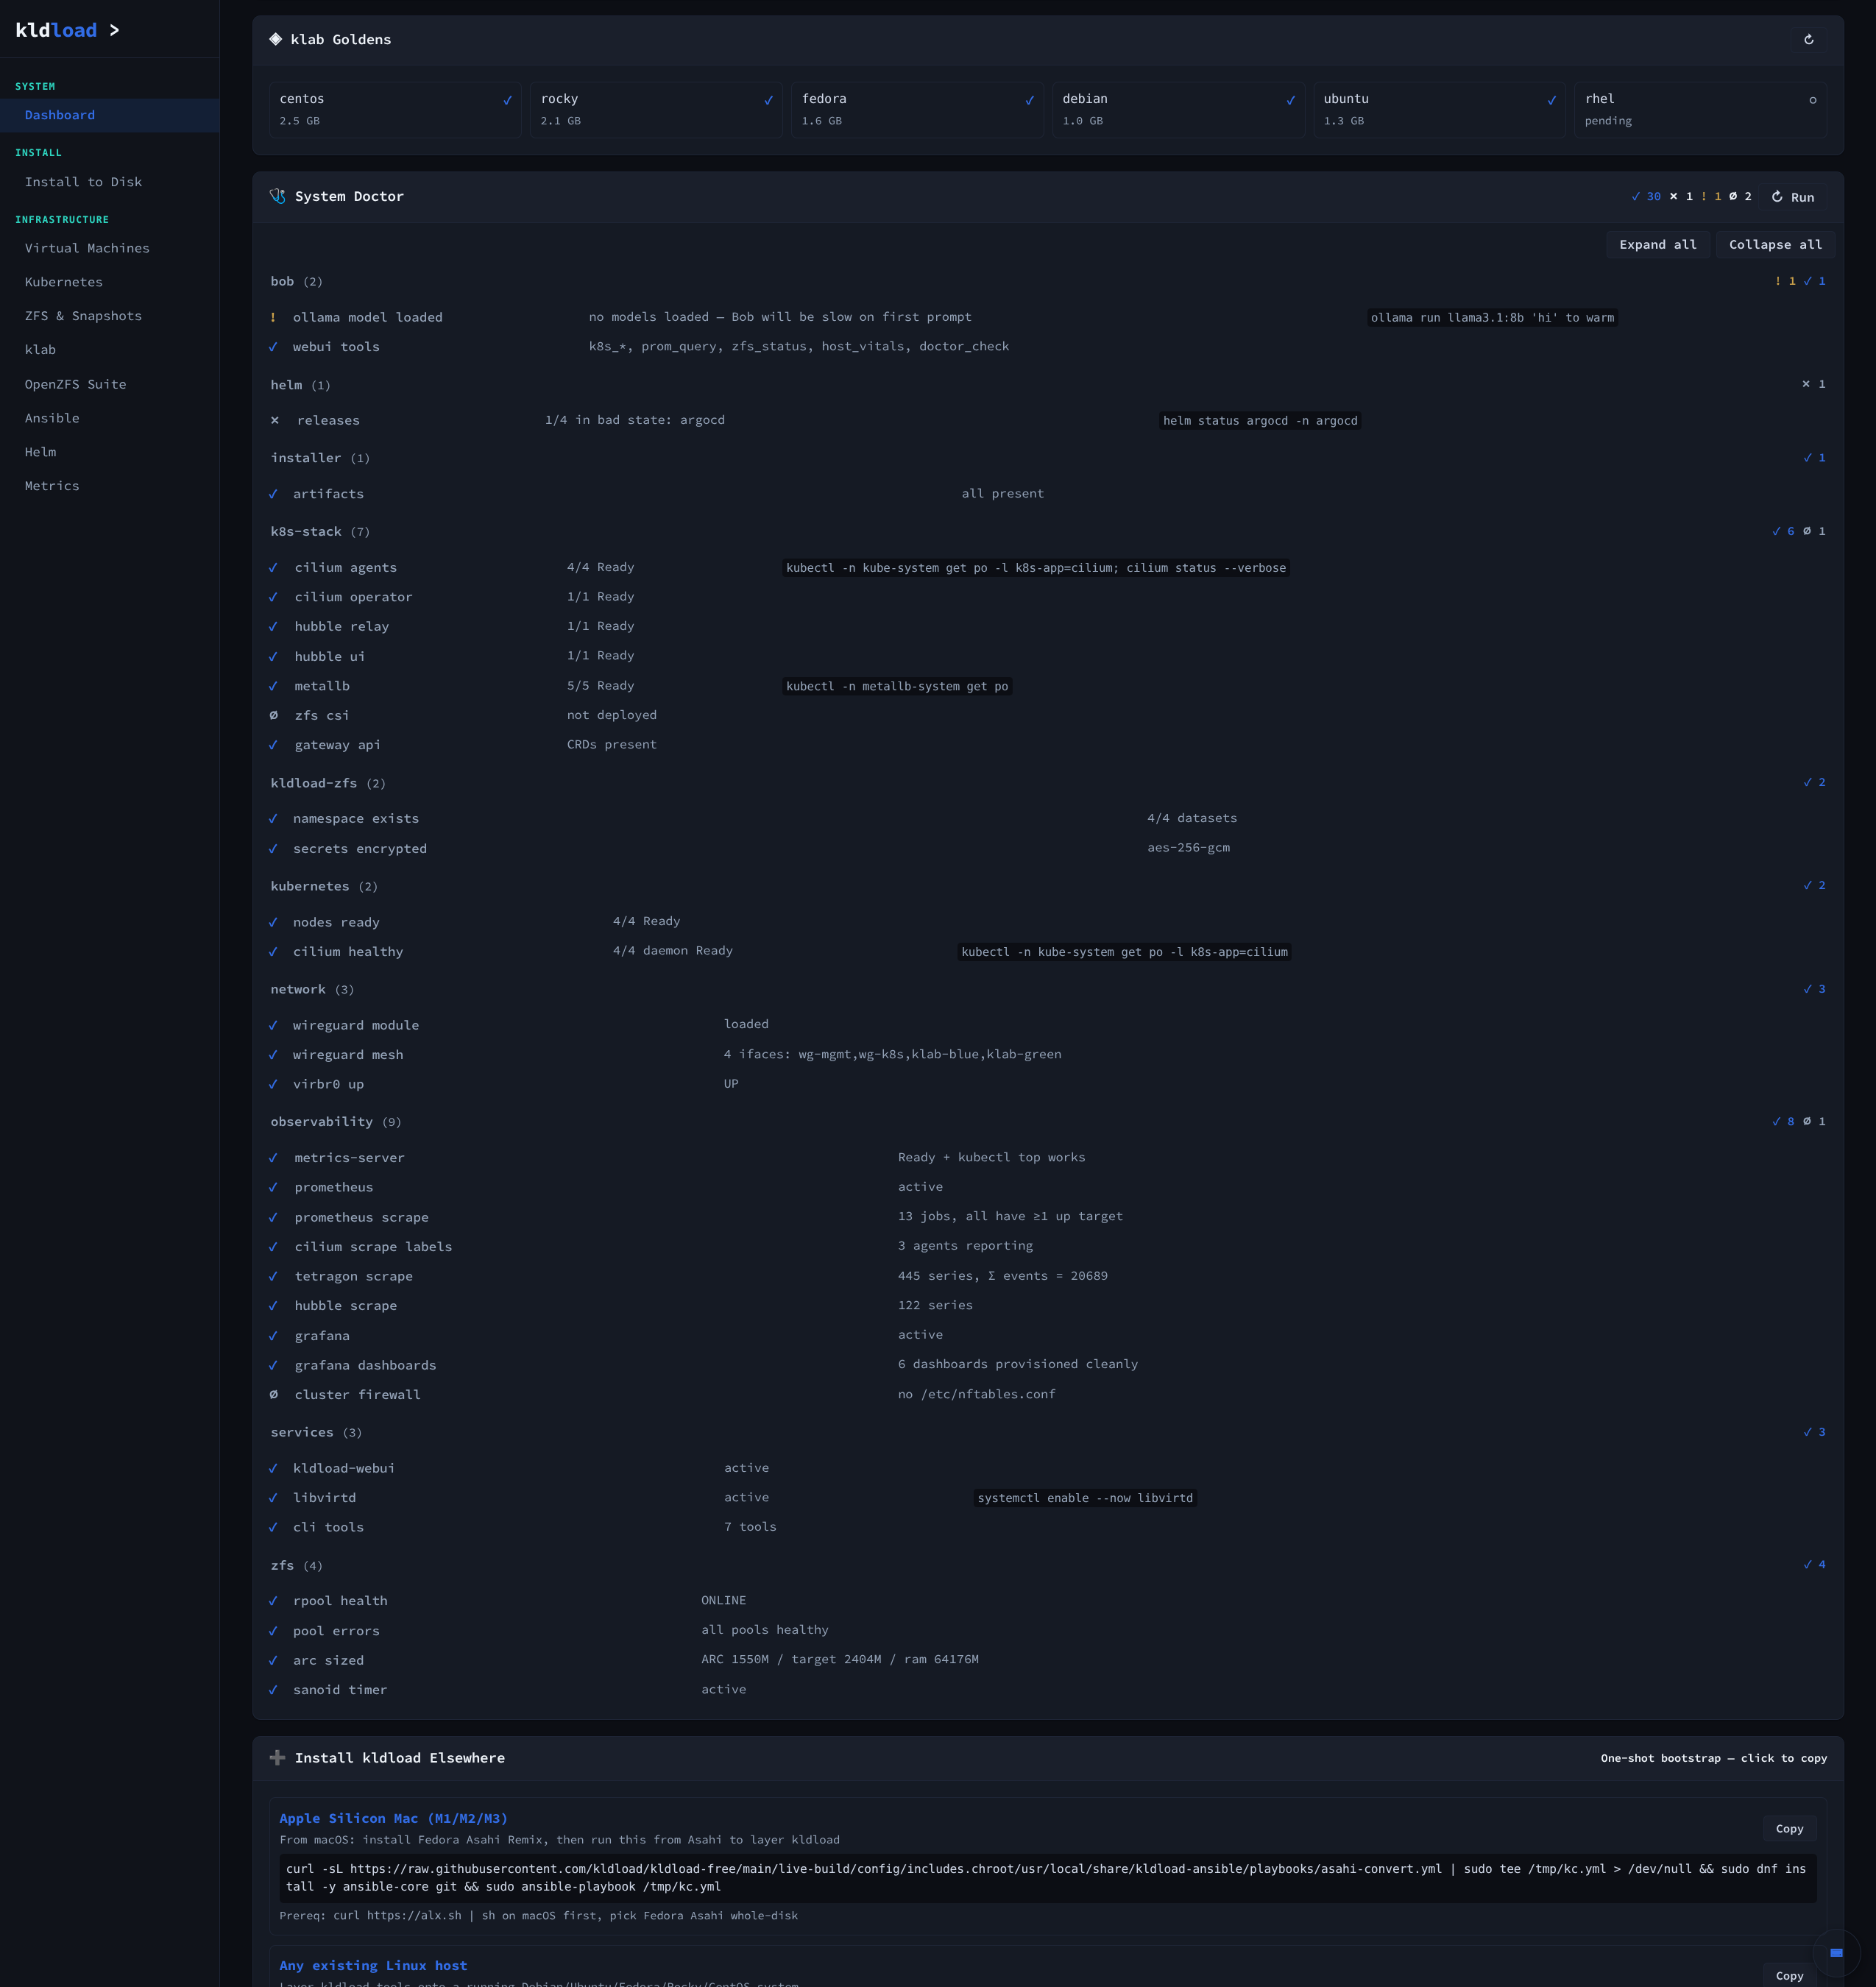
A live integrity check of everything that should be running — ZFS pool health, kernel module load, the metrics stack, the libvirt daemon, the K8s control plane. Green means “the install you booted from is correctly assembled and currently working.” The panel you check when something feels off, and the panel that should never need looking at.
Install to Disk
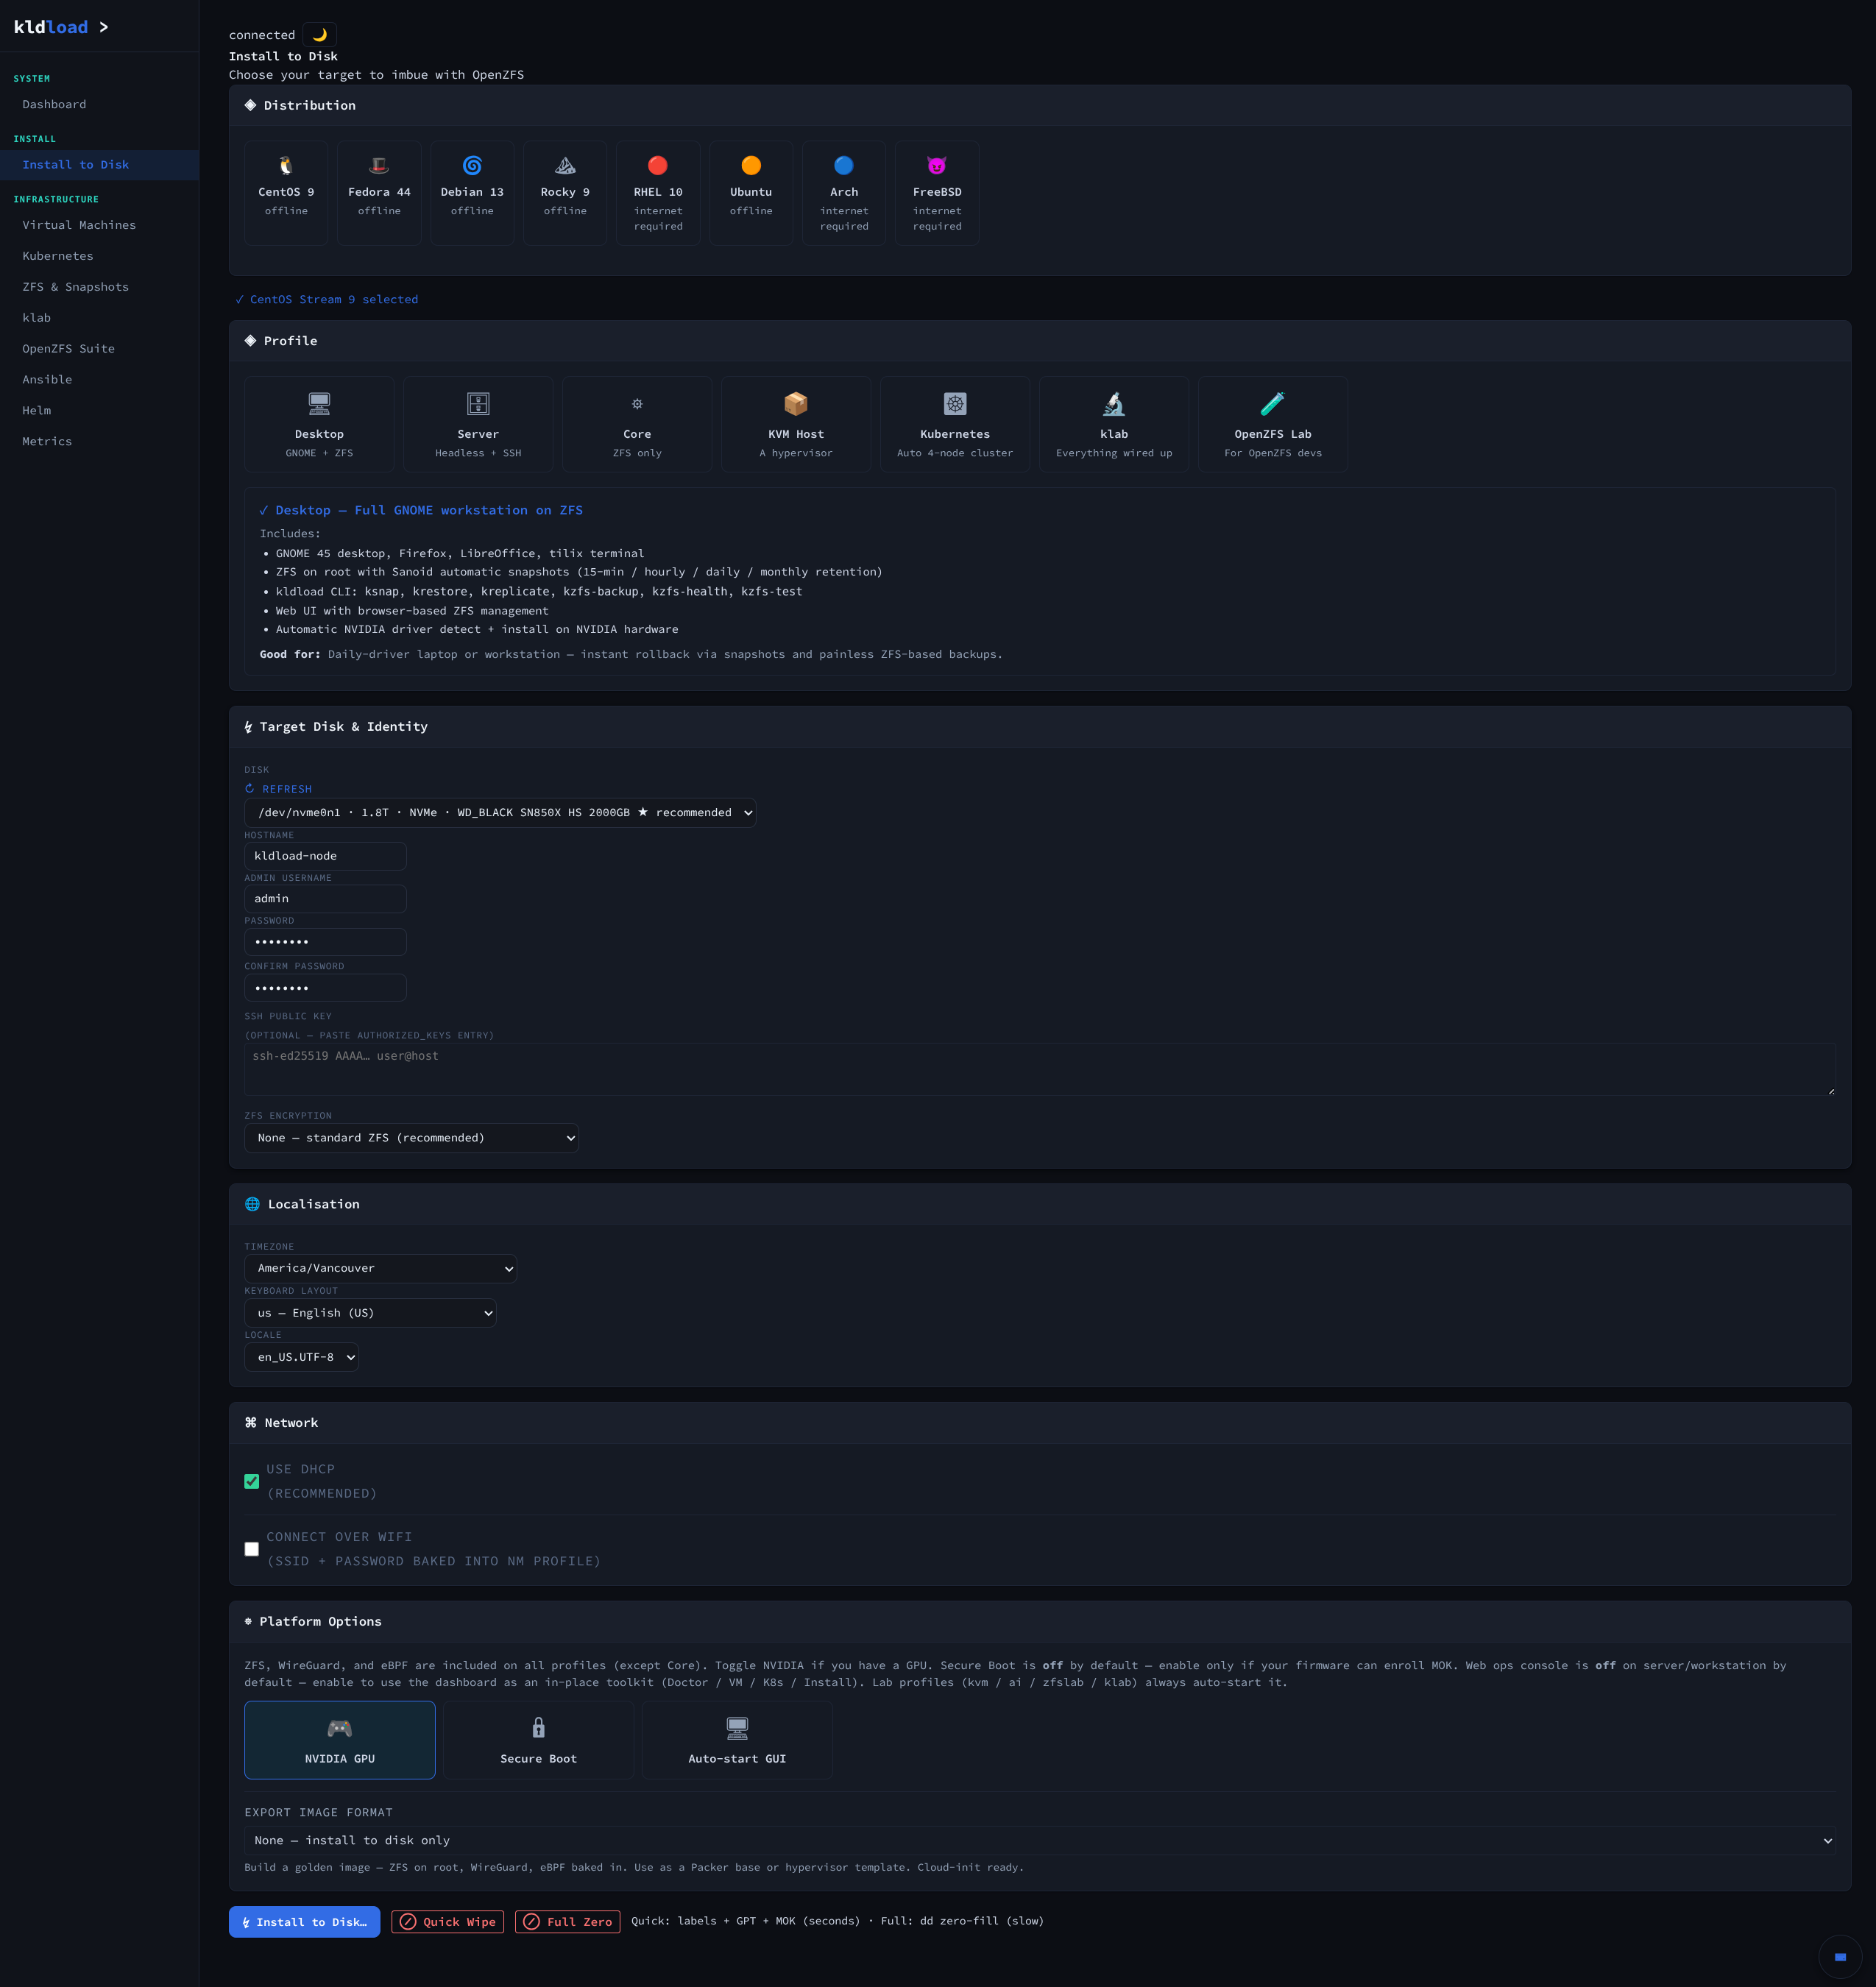
Pick your distro — CentOS Stream 9, Debian 13, Ubuntu 24.04, Fedora 43, RHEL 10, Rocky 9, Arch, or Alpine — pick your profile, pick your disk. Everything that comes up on the next boot — ZFS configured correctly at install time, WireGuard, KVM, Cilium eBPF, the full observability stack, and a clean set of boot environments — is wired in before the first reboot, not bolted on after.
Installing ZFS without configuring it is worse than not installing it at all. Default ARC sizes that starve your apps, the wrong ashift for the disk, compression left off, no scrub schedule, ZED disabled, a hostid that drifts and bricks the next boot — that’s the ZFS most people end up with. Every one of those is handled here at install time. You inherit a pool that’s actually safe to put data on.
One screen, one decision
The bullet list under the selected profile spells out exactly what comes up on the next boot — Desktop gives you GNOME + sanoid + NVIDIA-on-detect; the other profiles each have their own “included” bullet list visible in real time. One radio button decides the whole shape of the system.
Virtual Machines
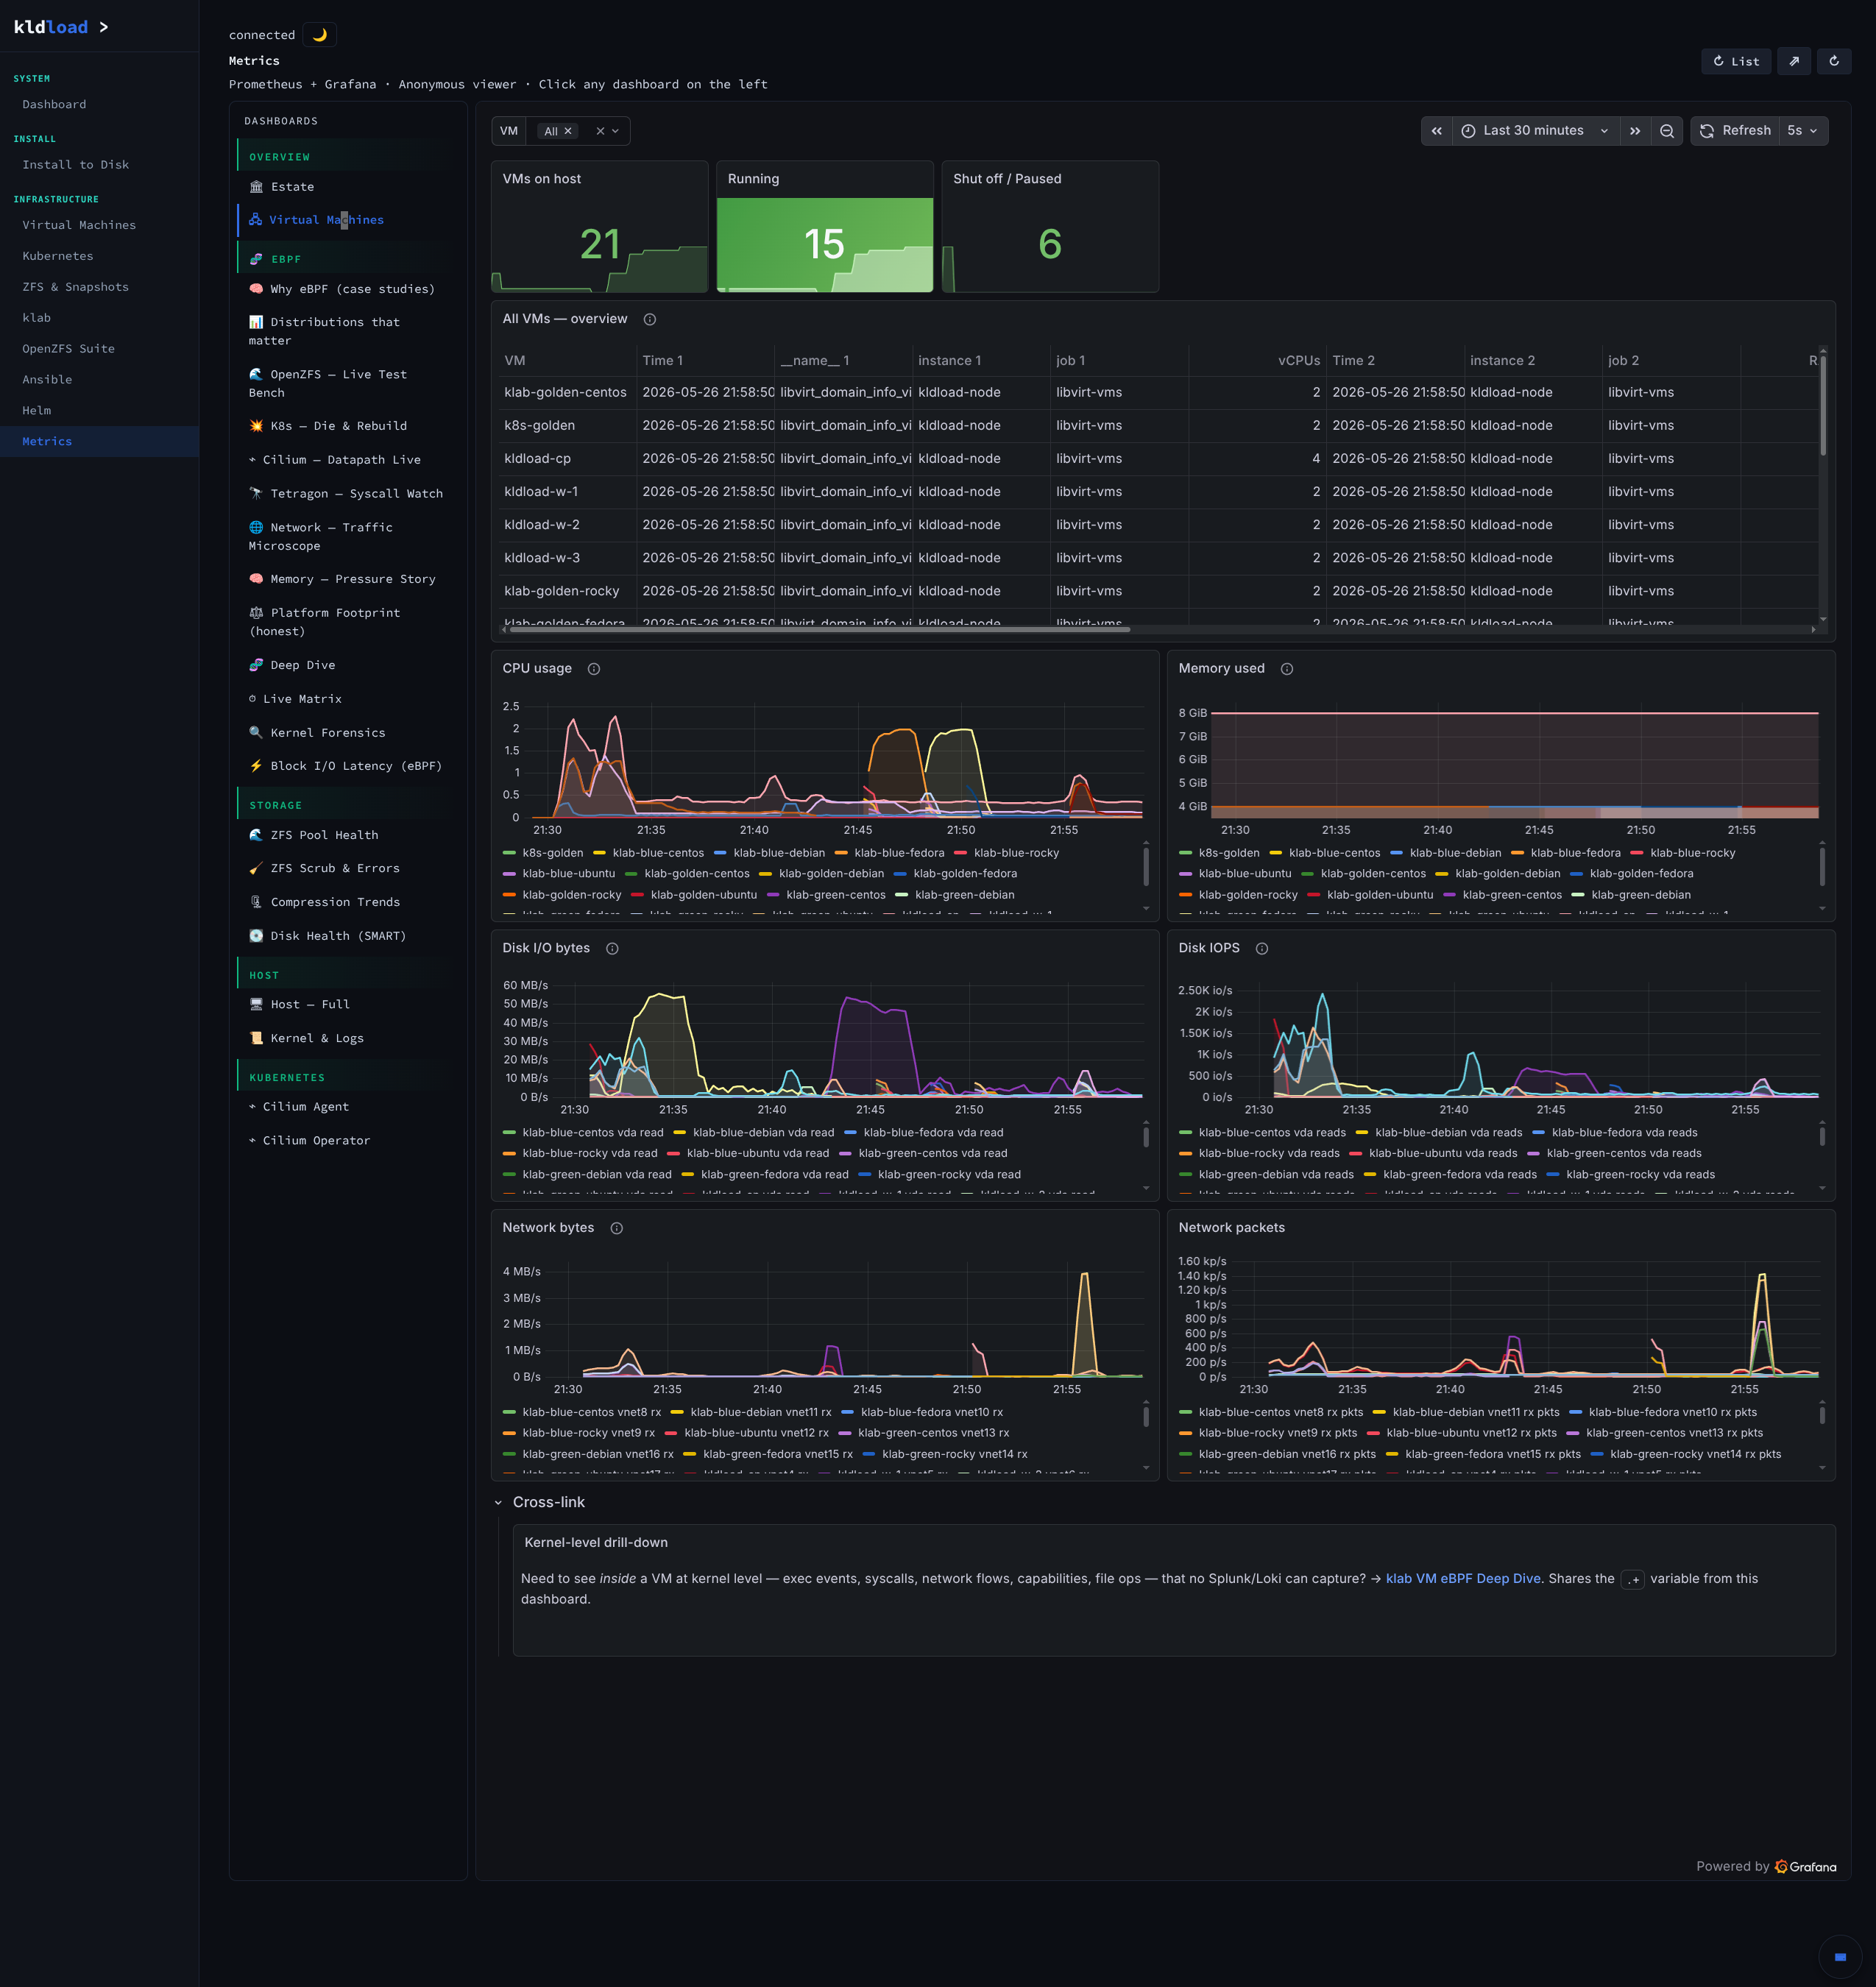
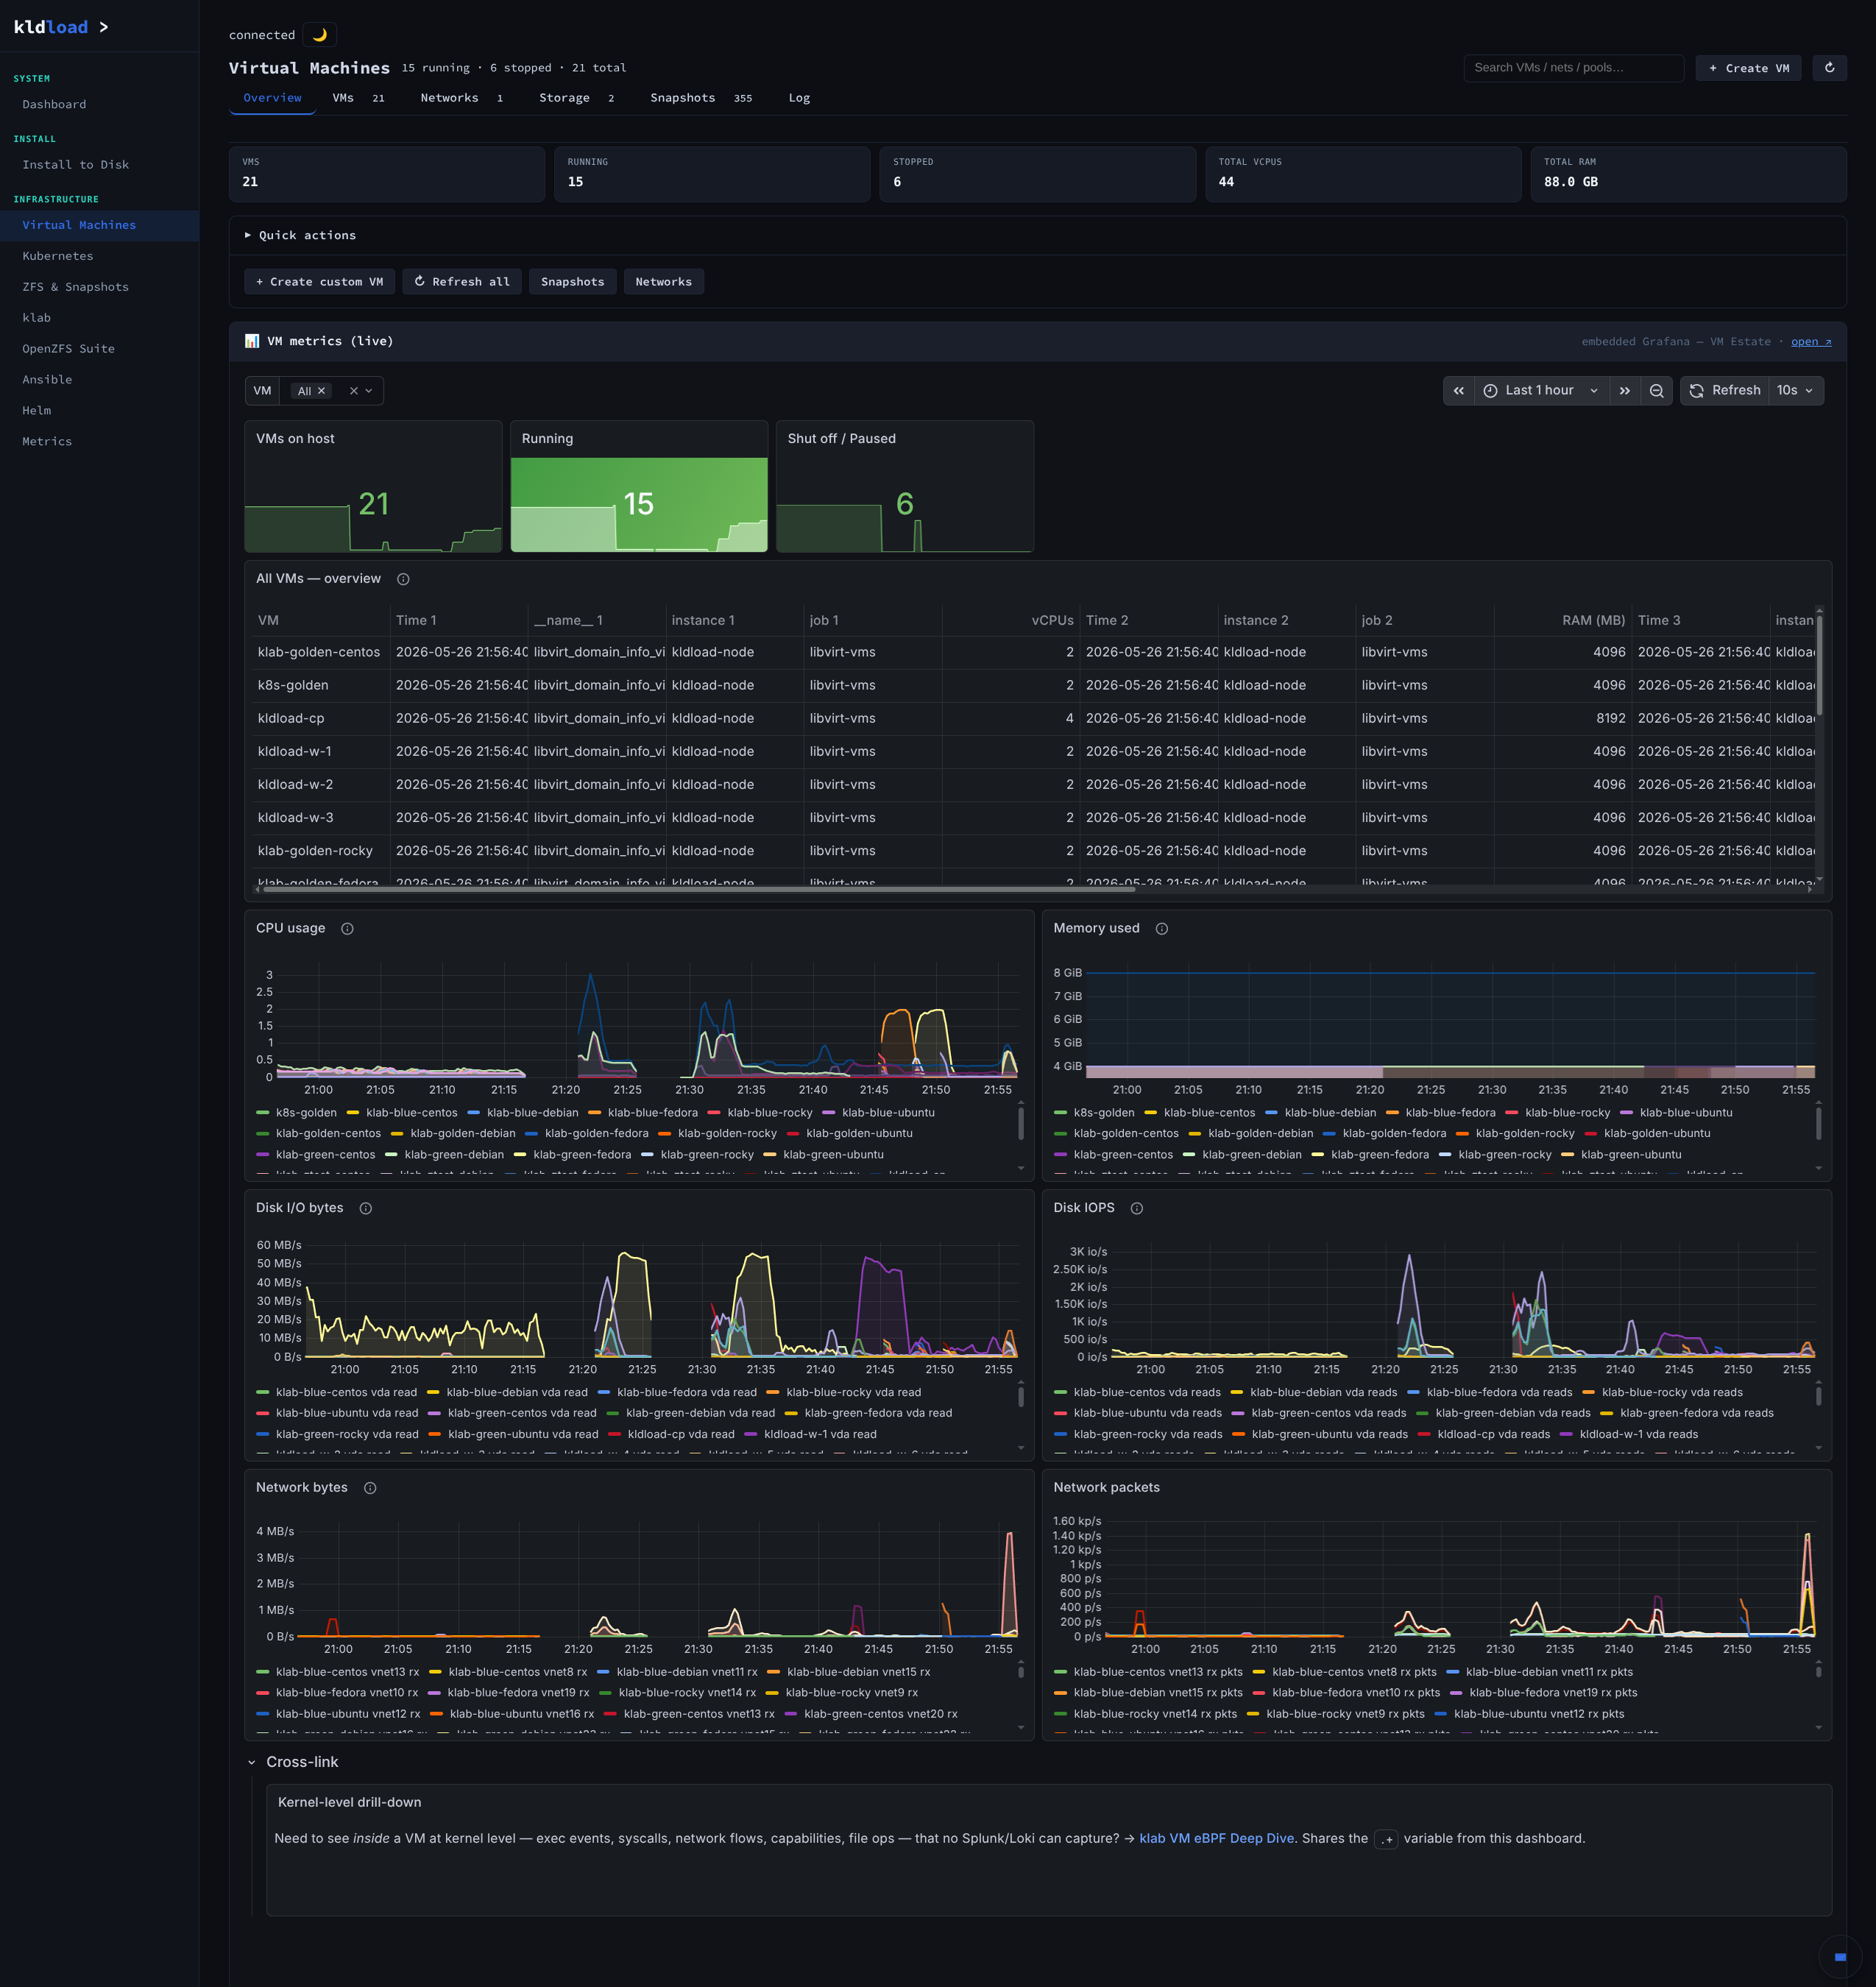
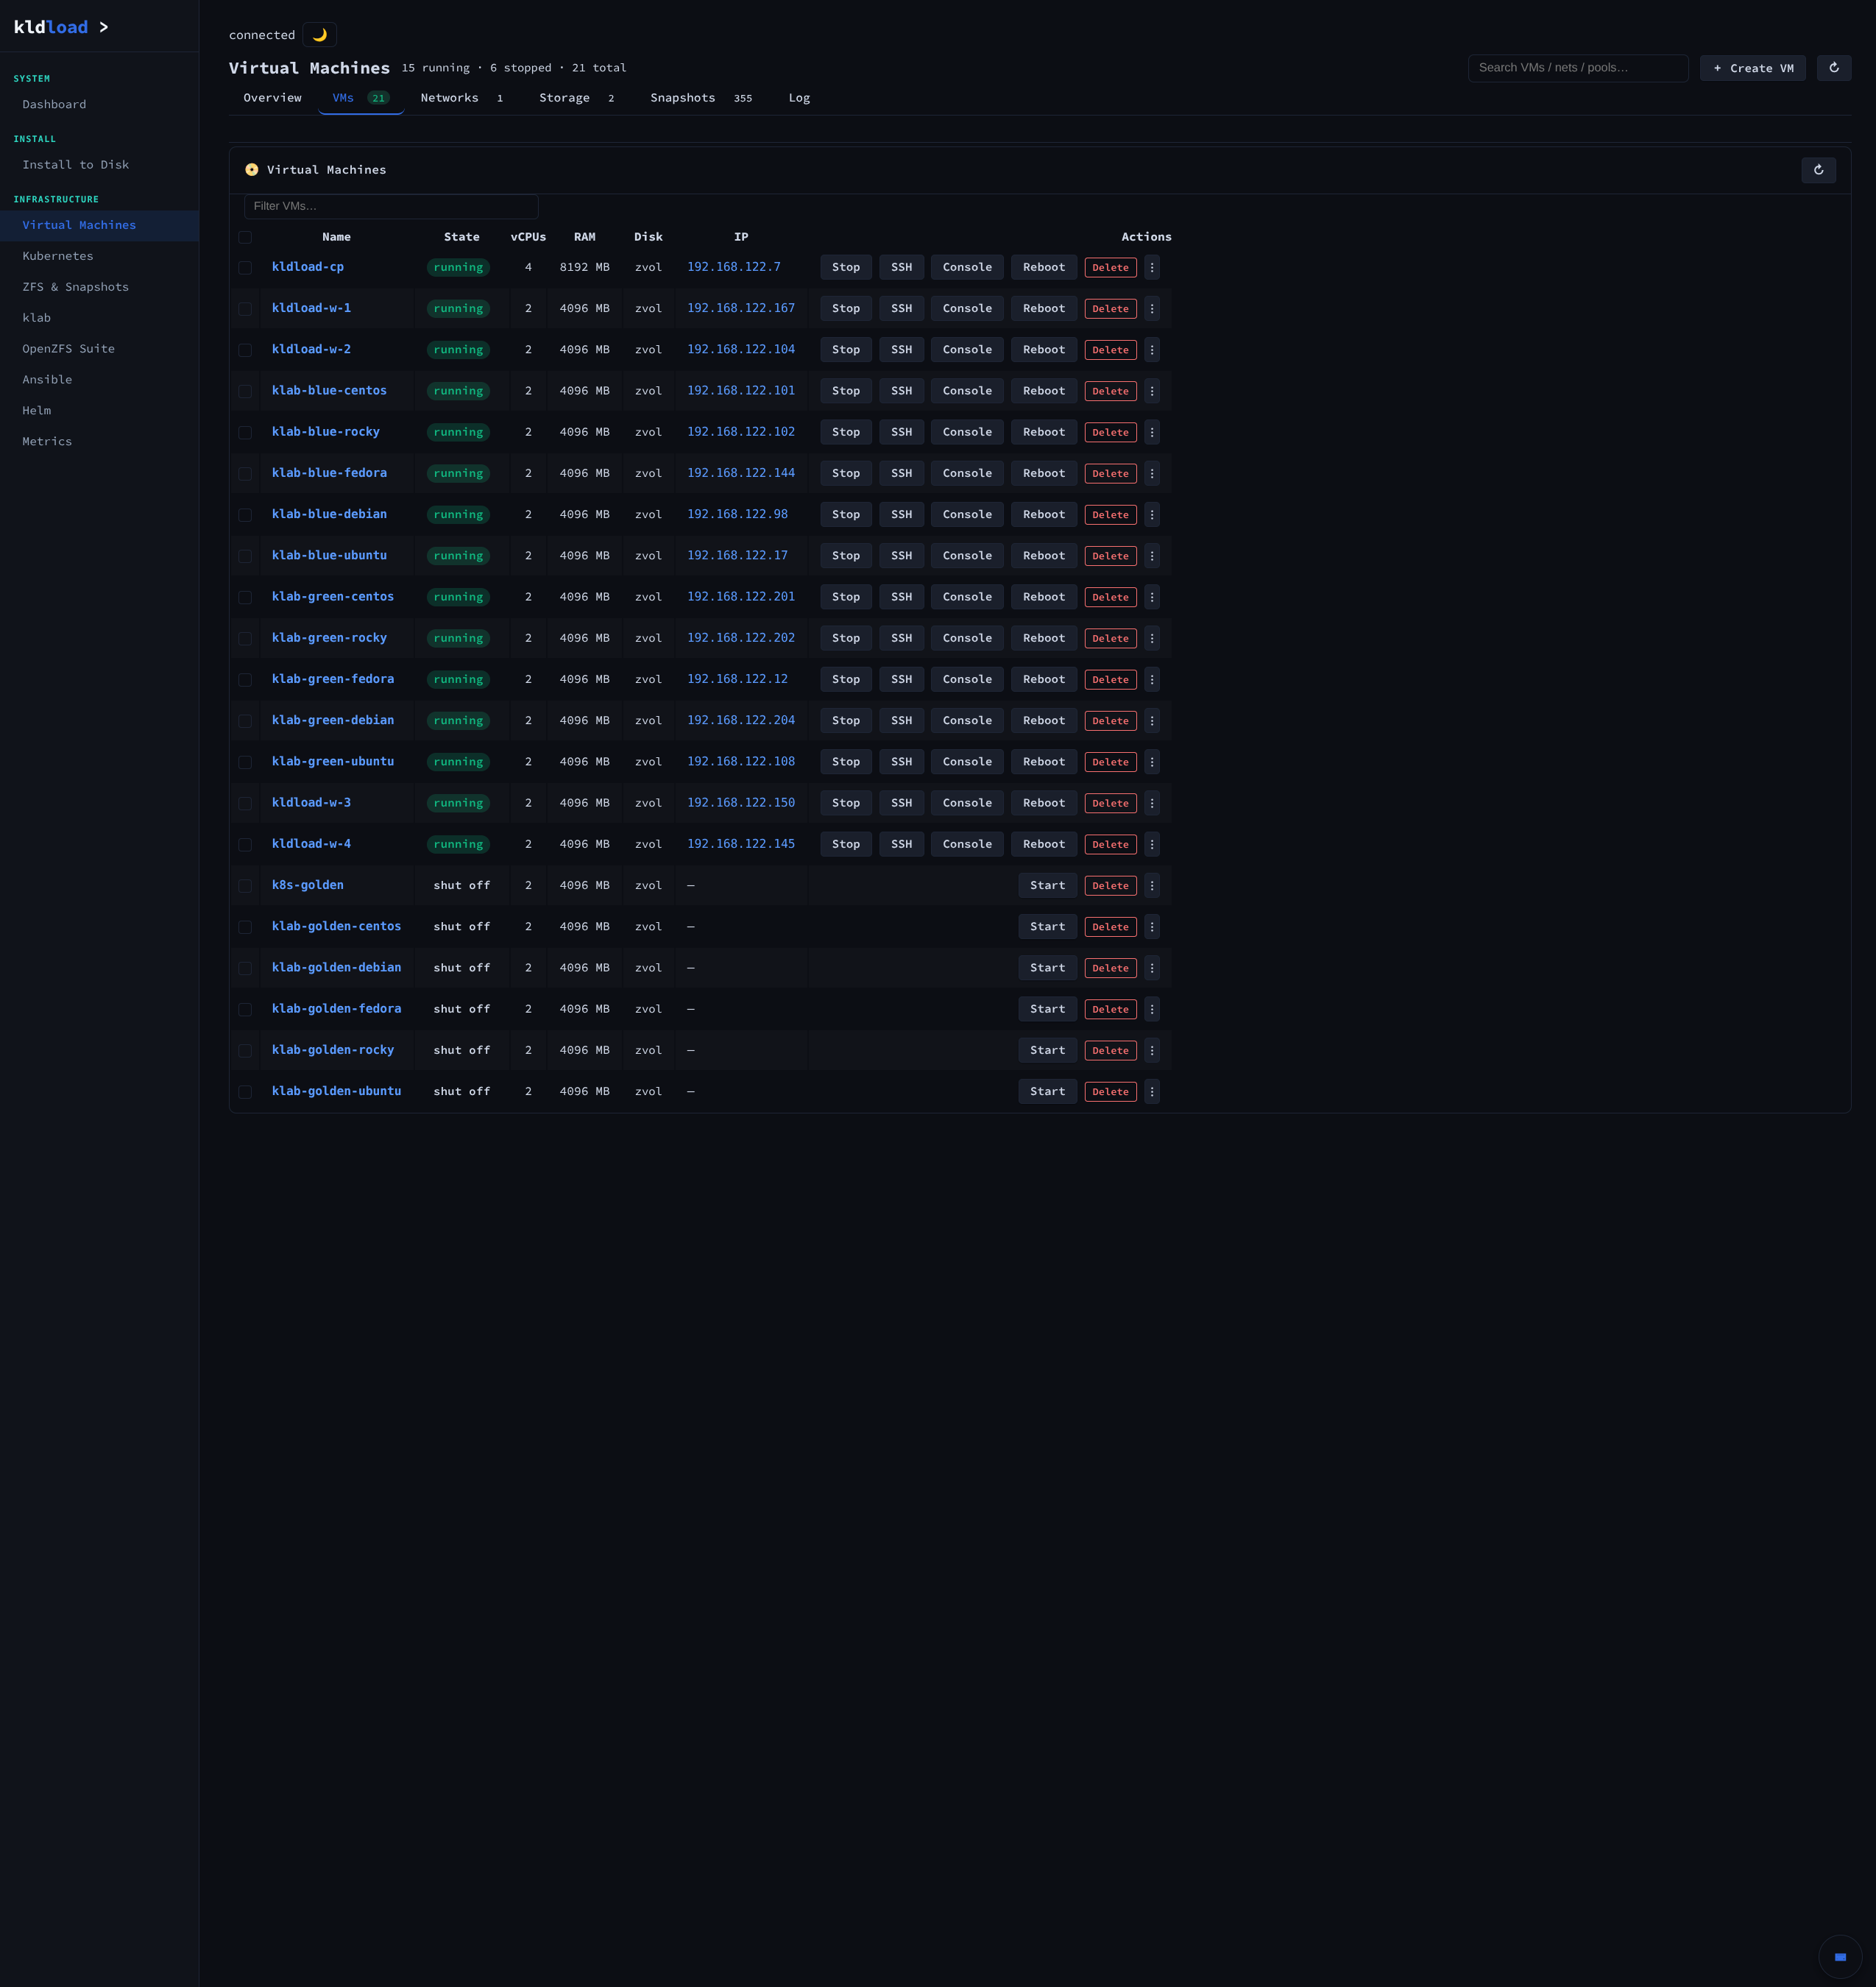
Cloud distros and custom installs, side by side, all on one pool. Some rows are stock cloud images; the rest are hand-baked, pre-provisioned, ready to clone. Under every row sits ZFS — same as the Kubernetes persistent volumes, the database files, the container layers. No CSI sidecar to deploy. No second storage tier to operate. Snapshot in a heartbeat, clone in another, roll back before the alert finishes paging.
The GPU is multi-tenant by default. Most KVM setups force a binary choice: pass the card to one VM, that VM owns it forever. Here the same GPU can feed the local AI assistant, a Windows VM running CAD, a Linux VM transcoding video, and a Kubernetes pod doing inference — concurrently. vfio-pci for full passthrough, mdev / vGPU partitioning where the hardware supports it, NVIDIA MIG slicing on data-center cards, the GPU operator on the K8s side.
Inventory, networks, storage, snapshots, log
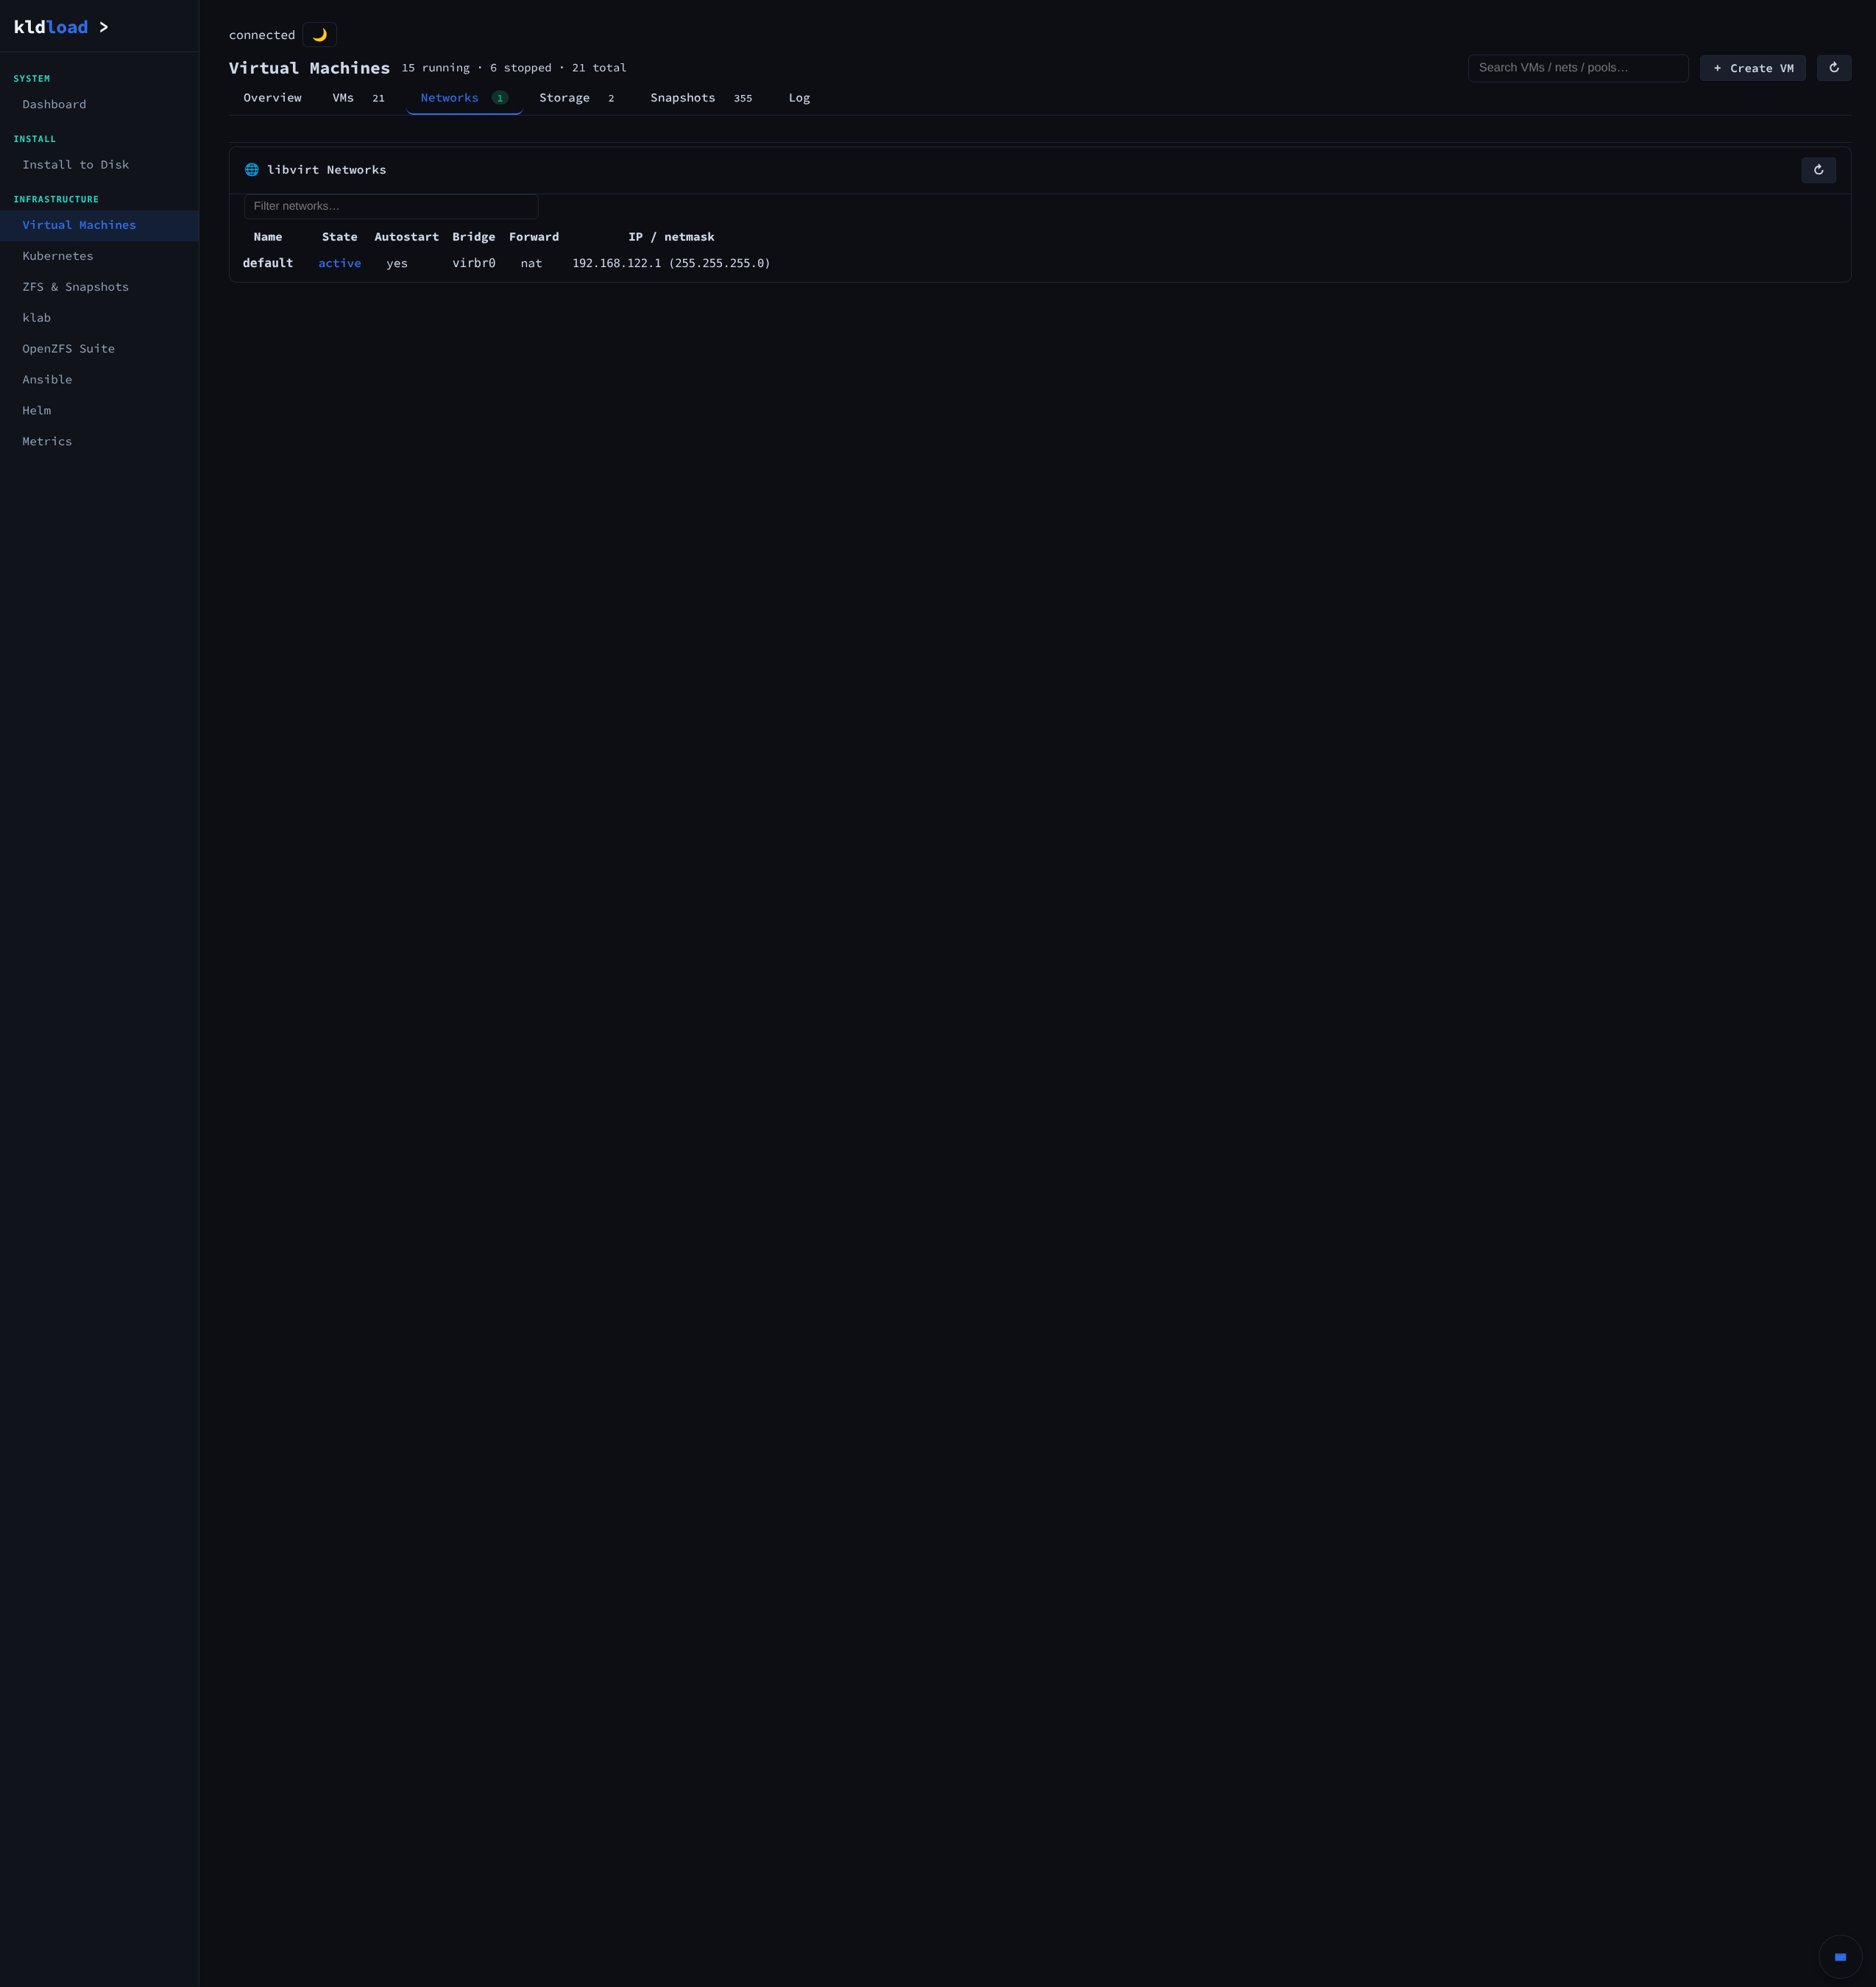
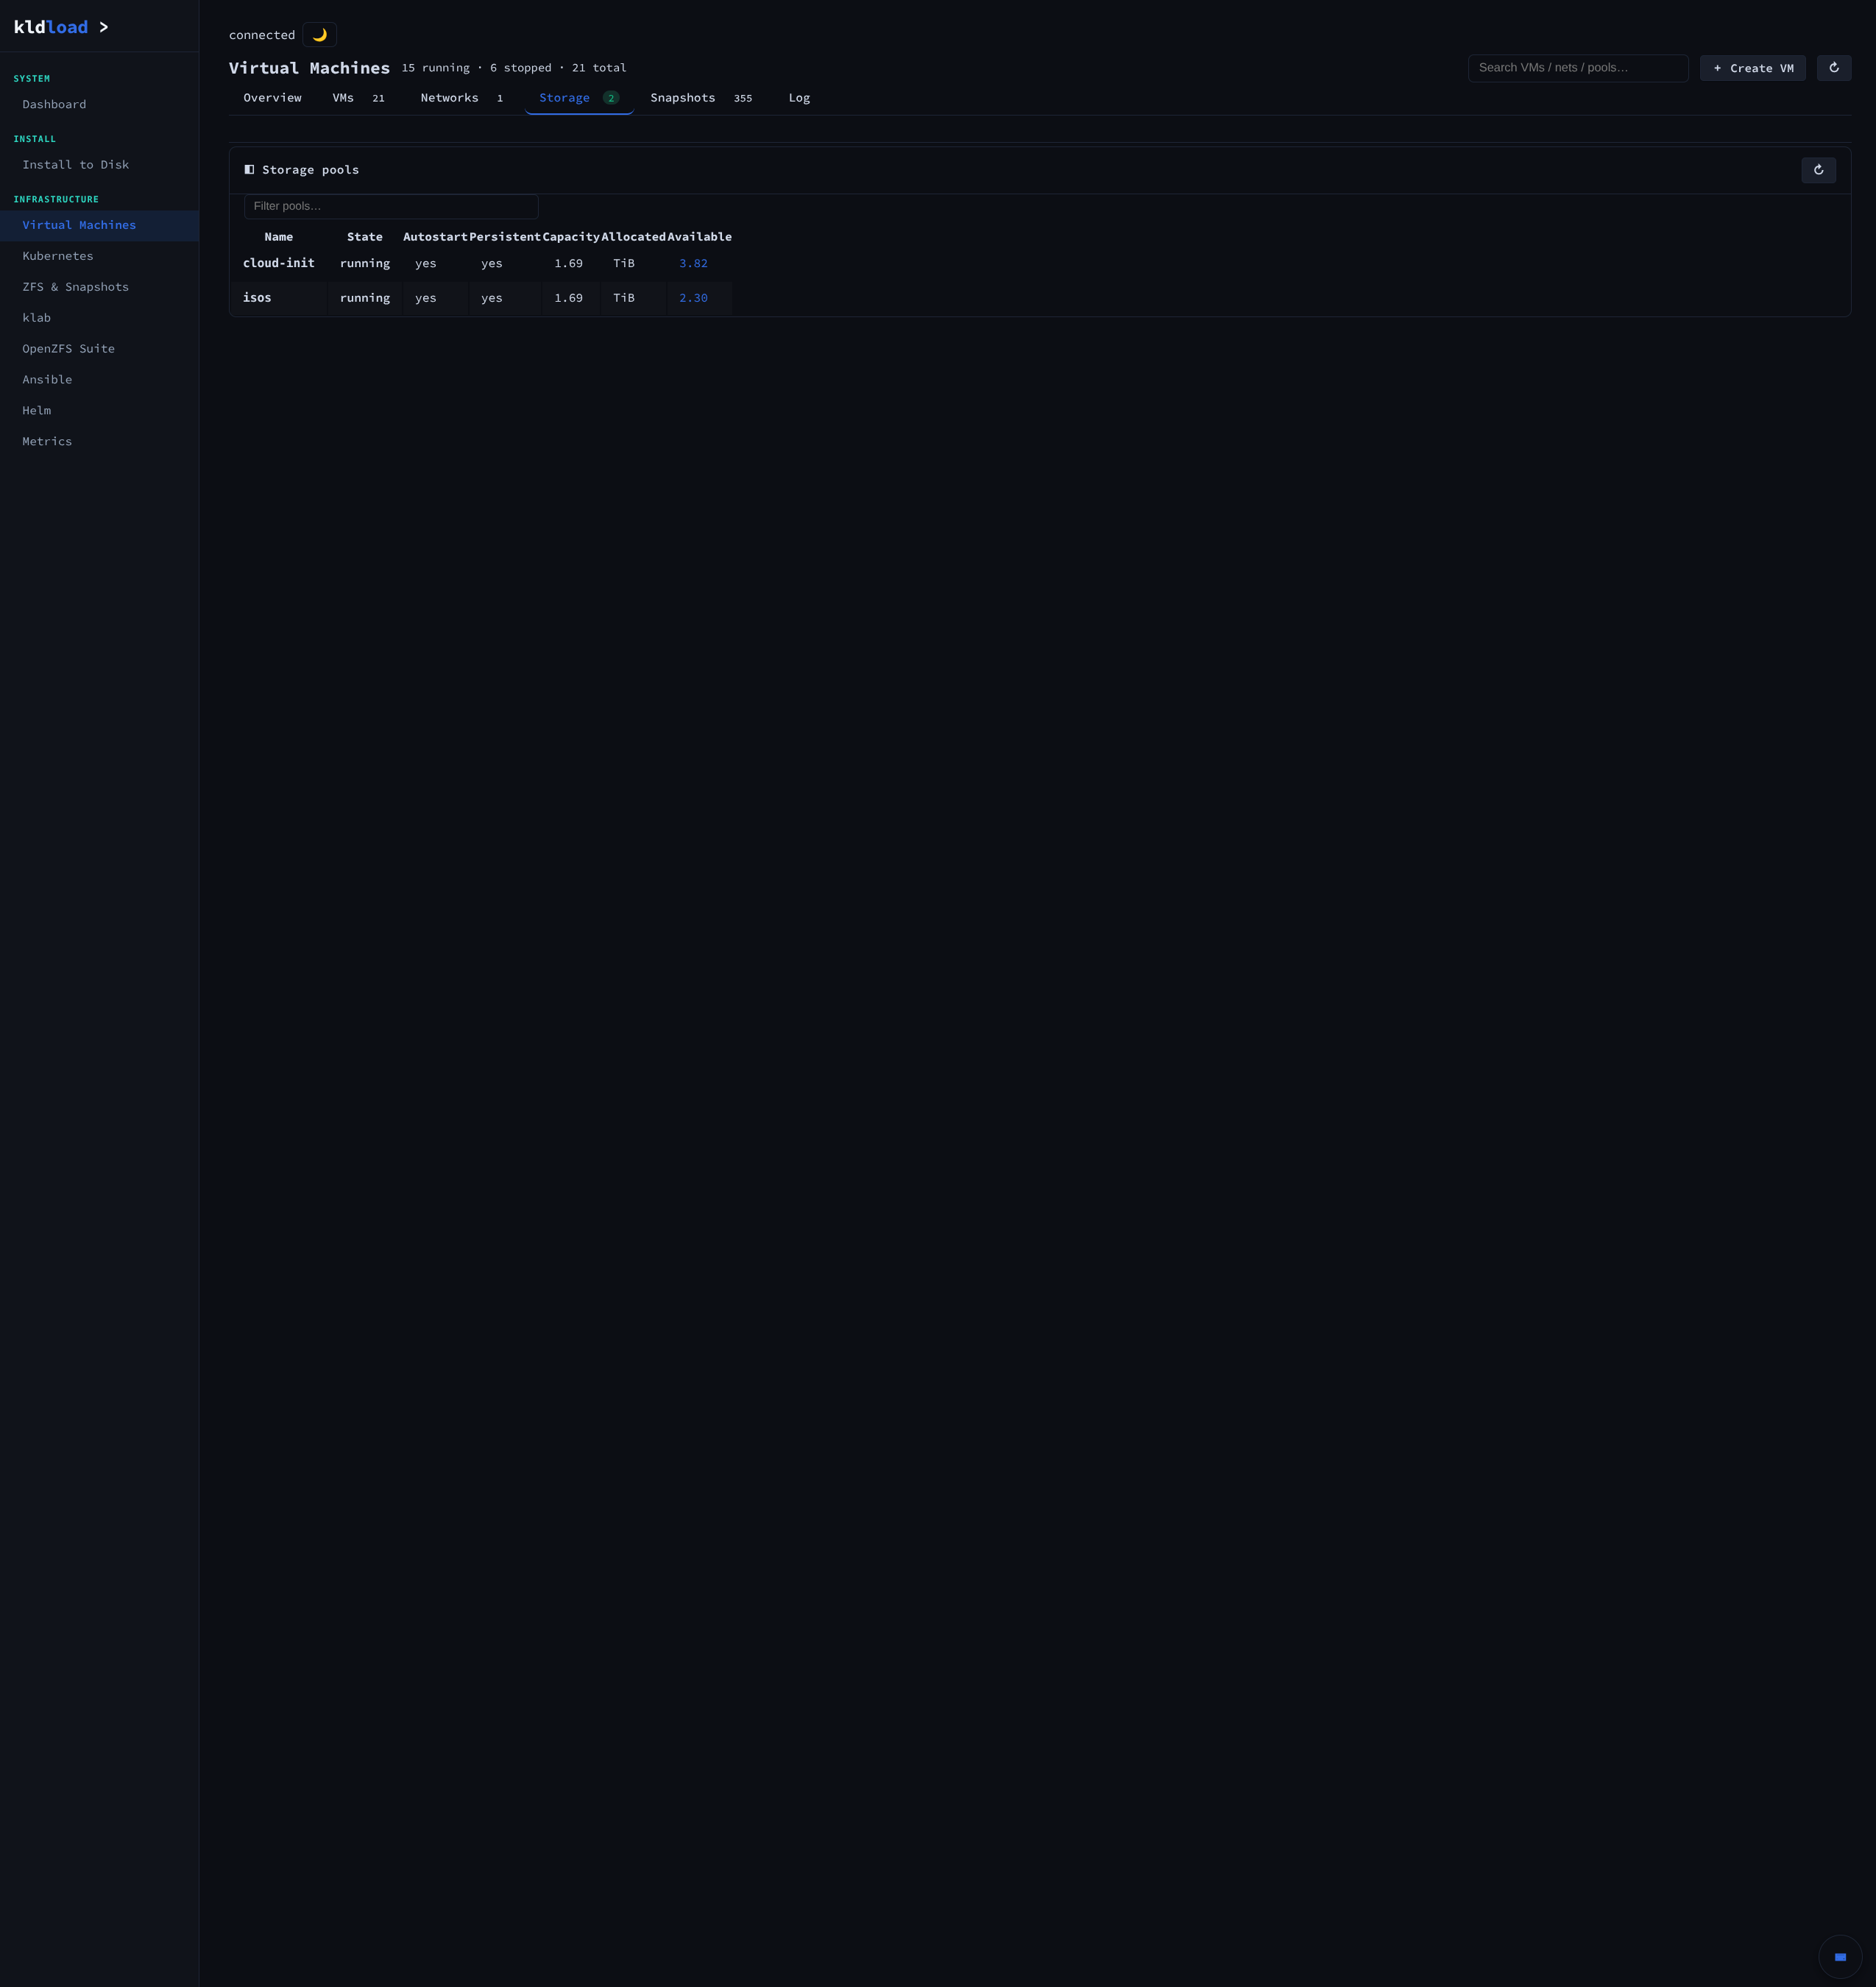
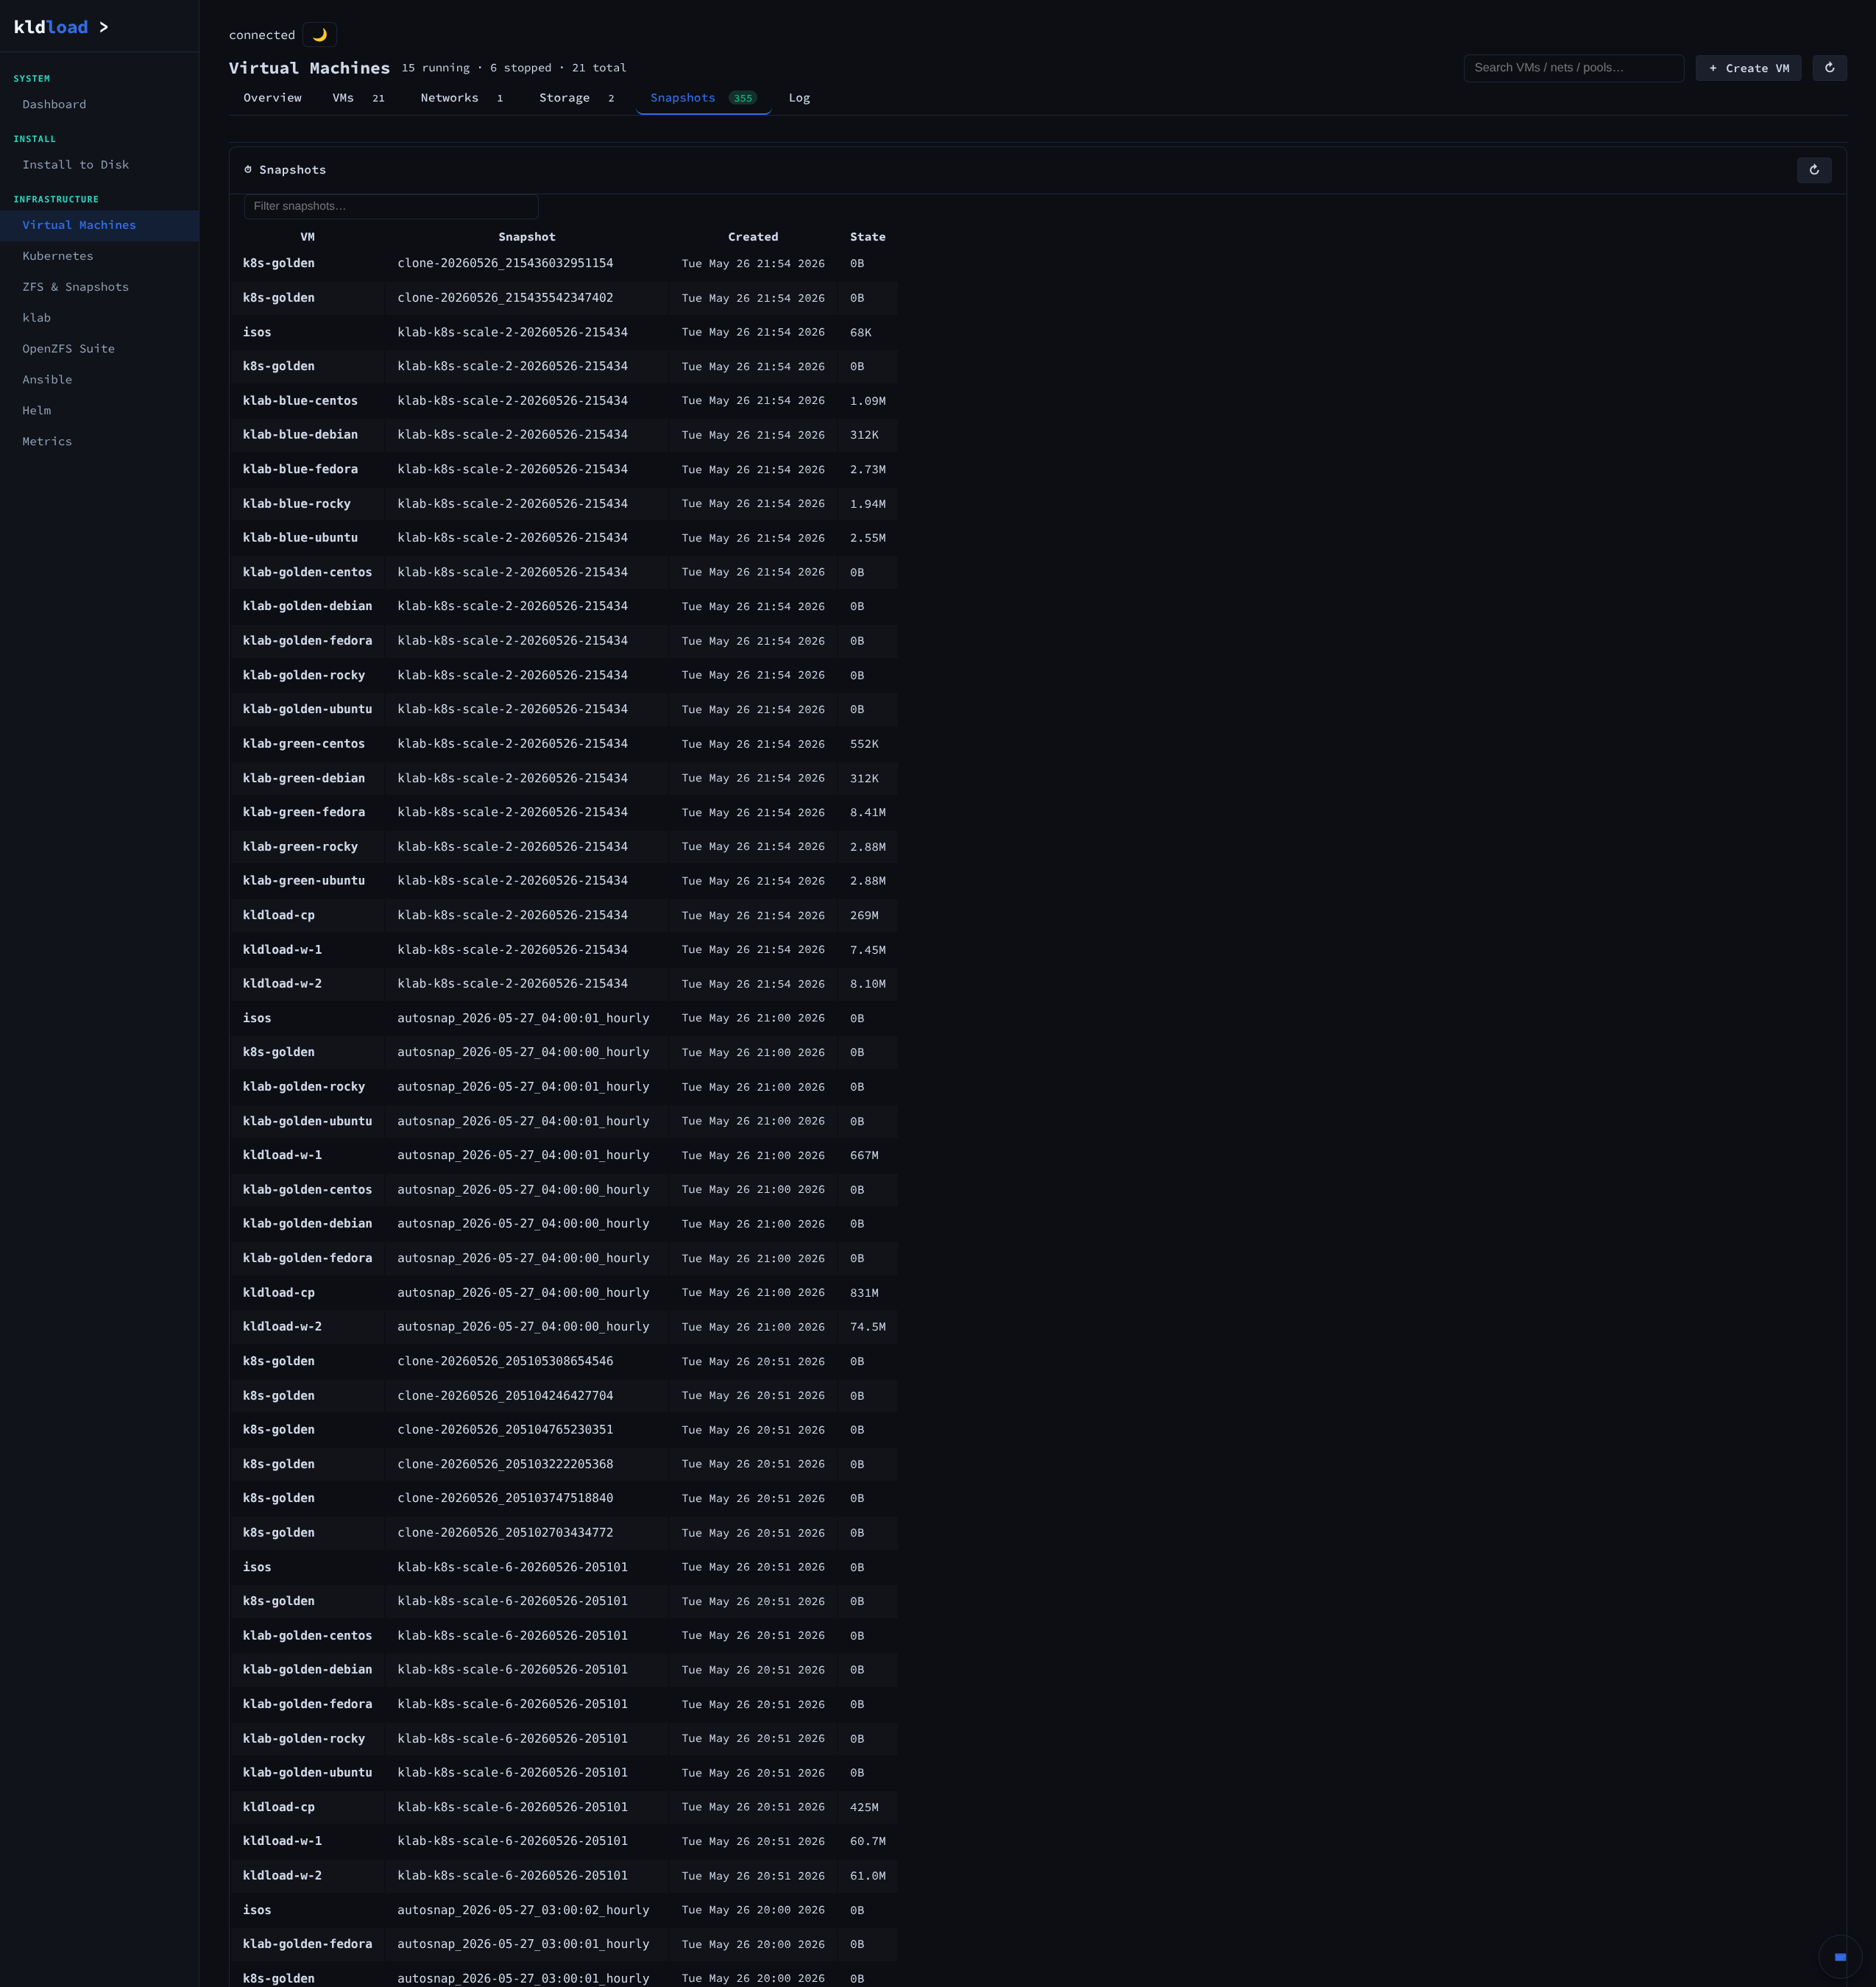
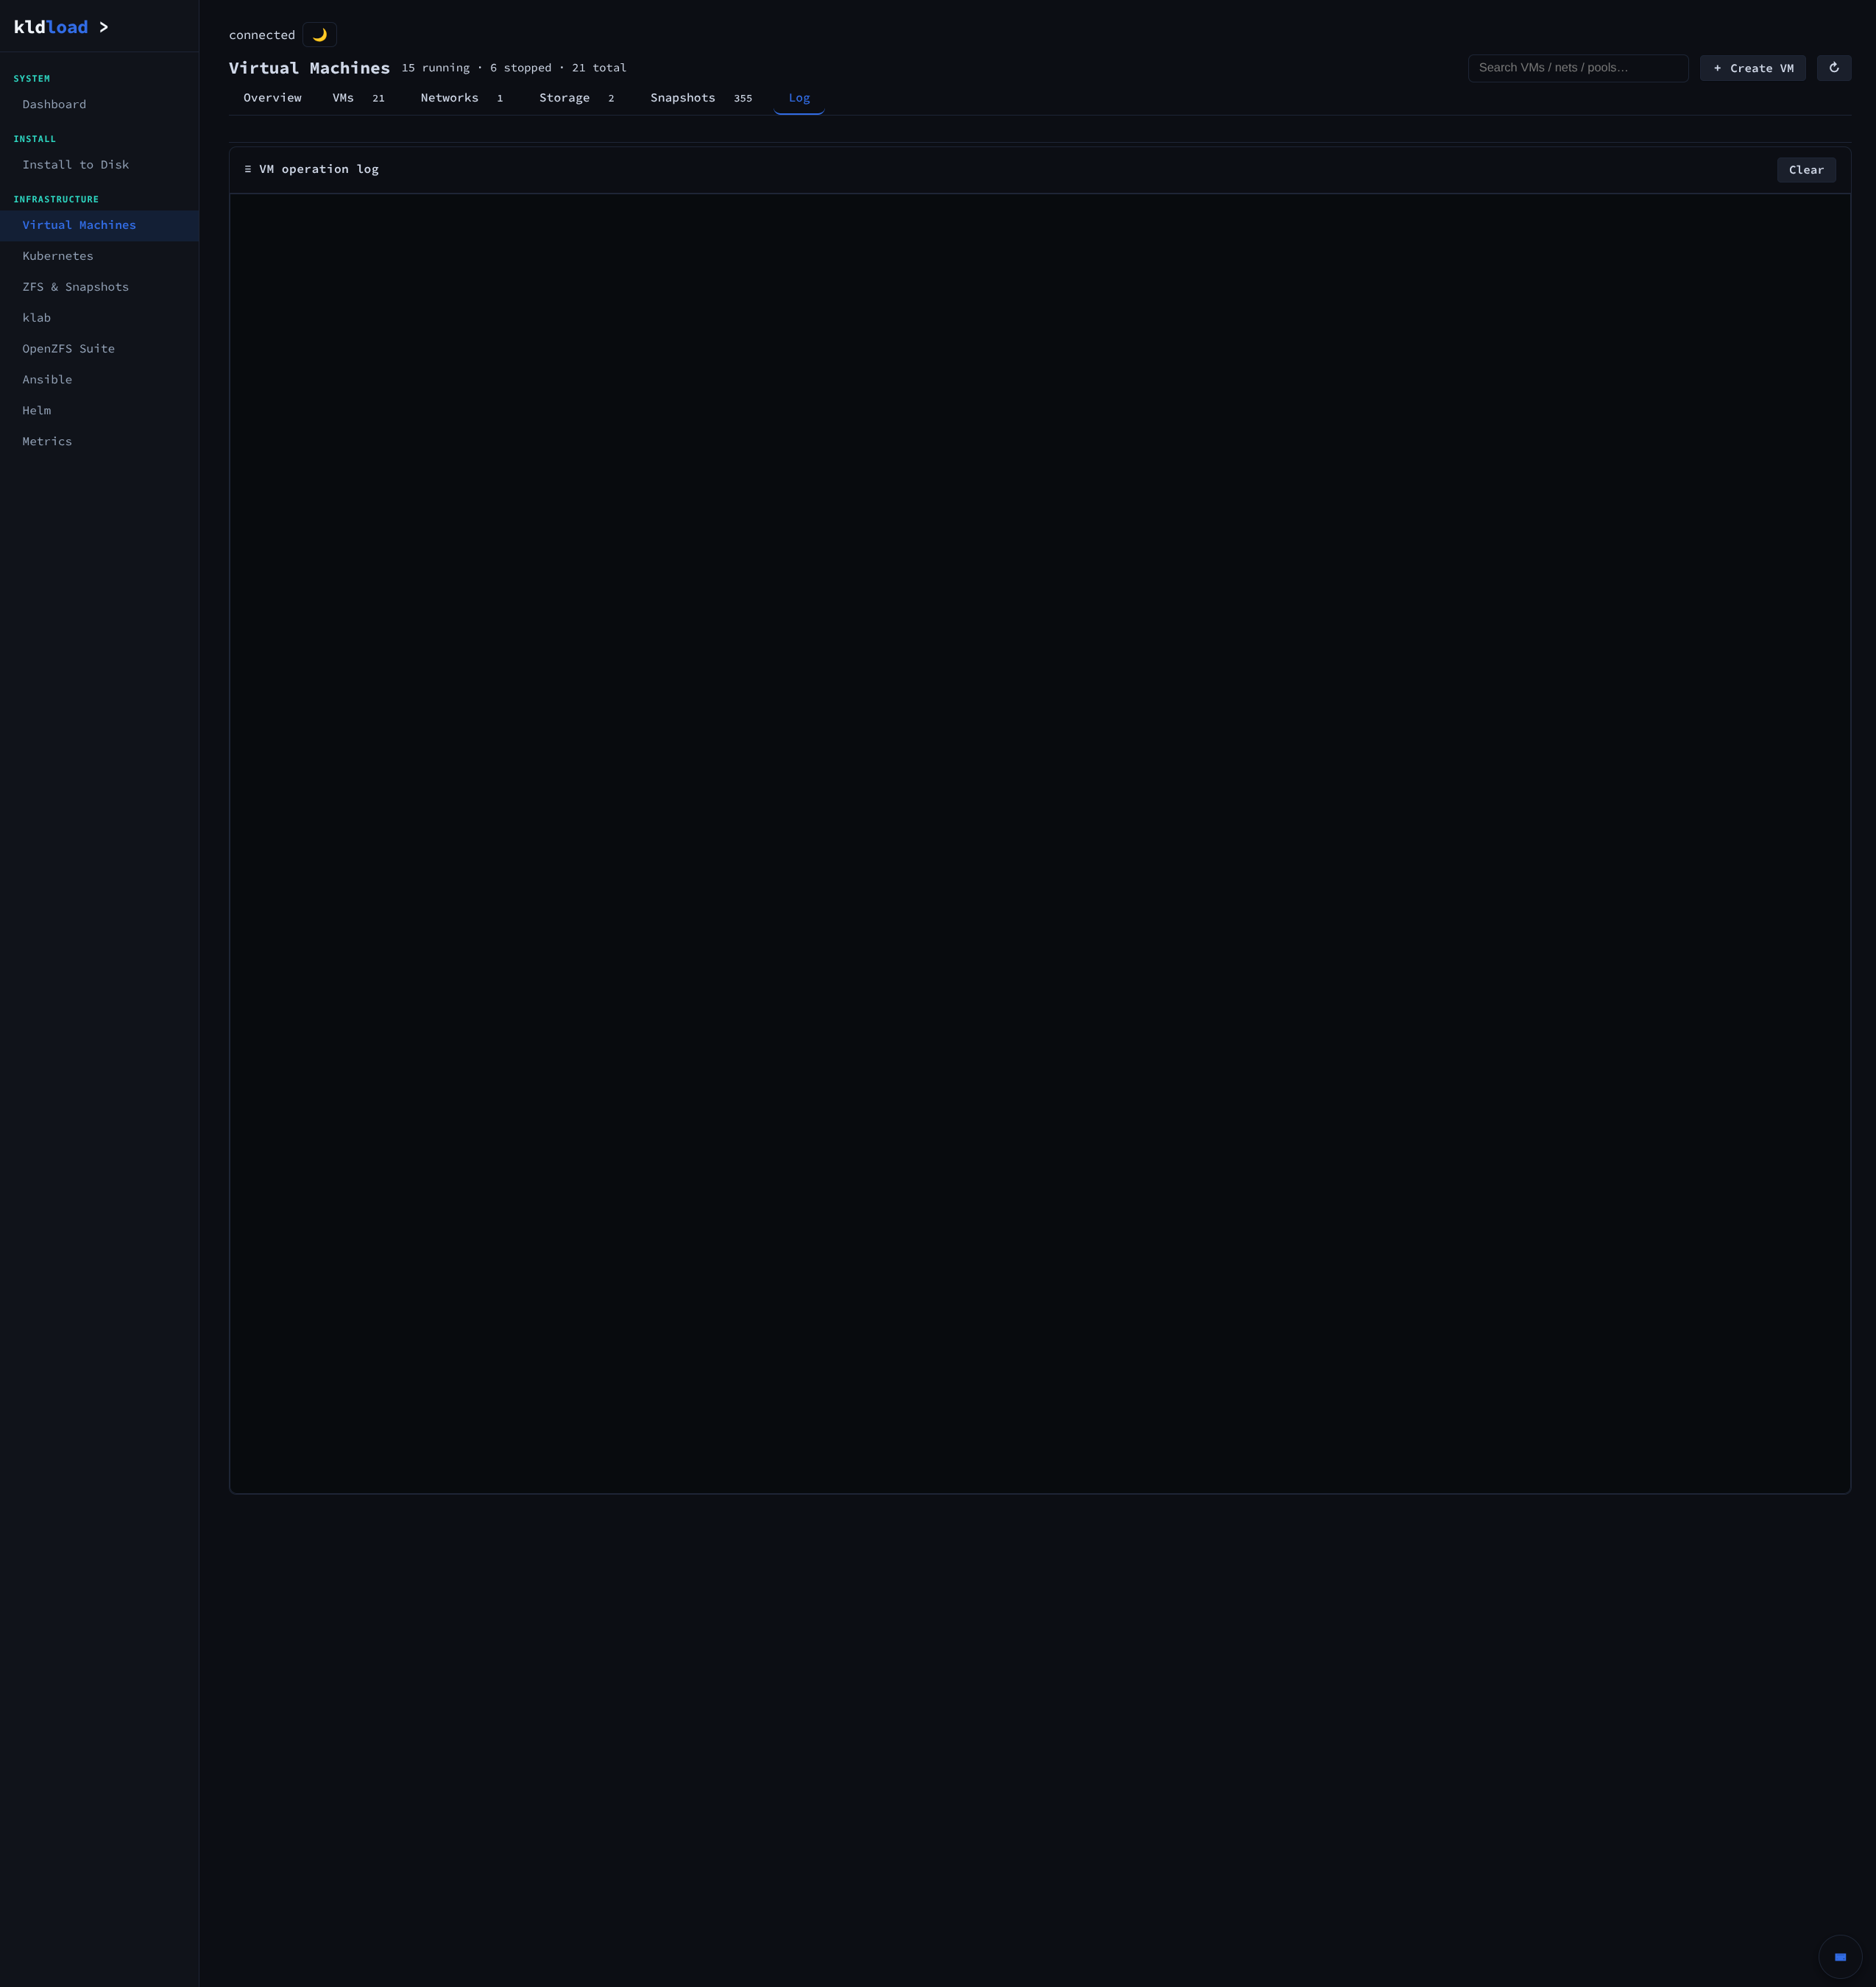
Six sub-tabs cover everything libvirt knows: Overview (Grafana embed), the VM list (21 machines on one box), Networks (one bridge, hundreds of endpoints courtesy of Cilium), Storage (cloud-init + ISO pools), Snapshots (hundreds, automatic, sanoid-driven), and the operation log.
Kubernetes
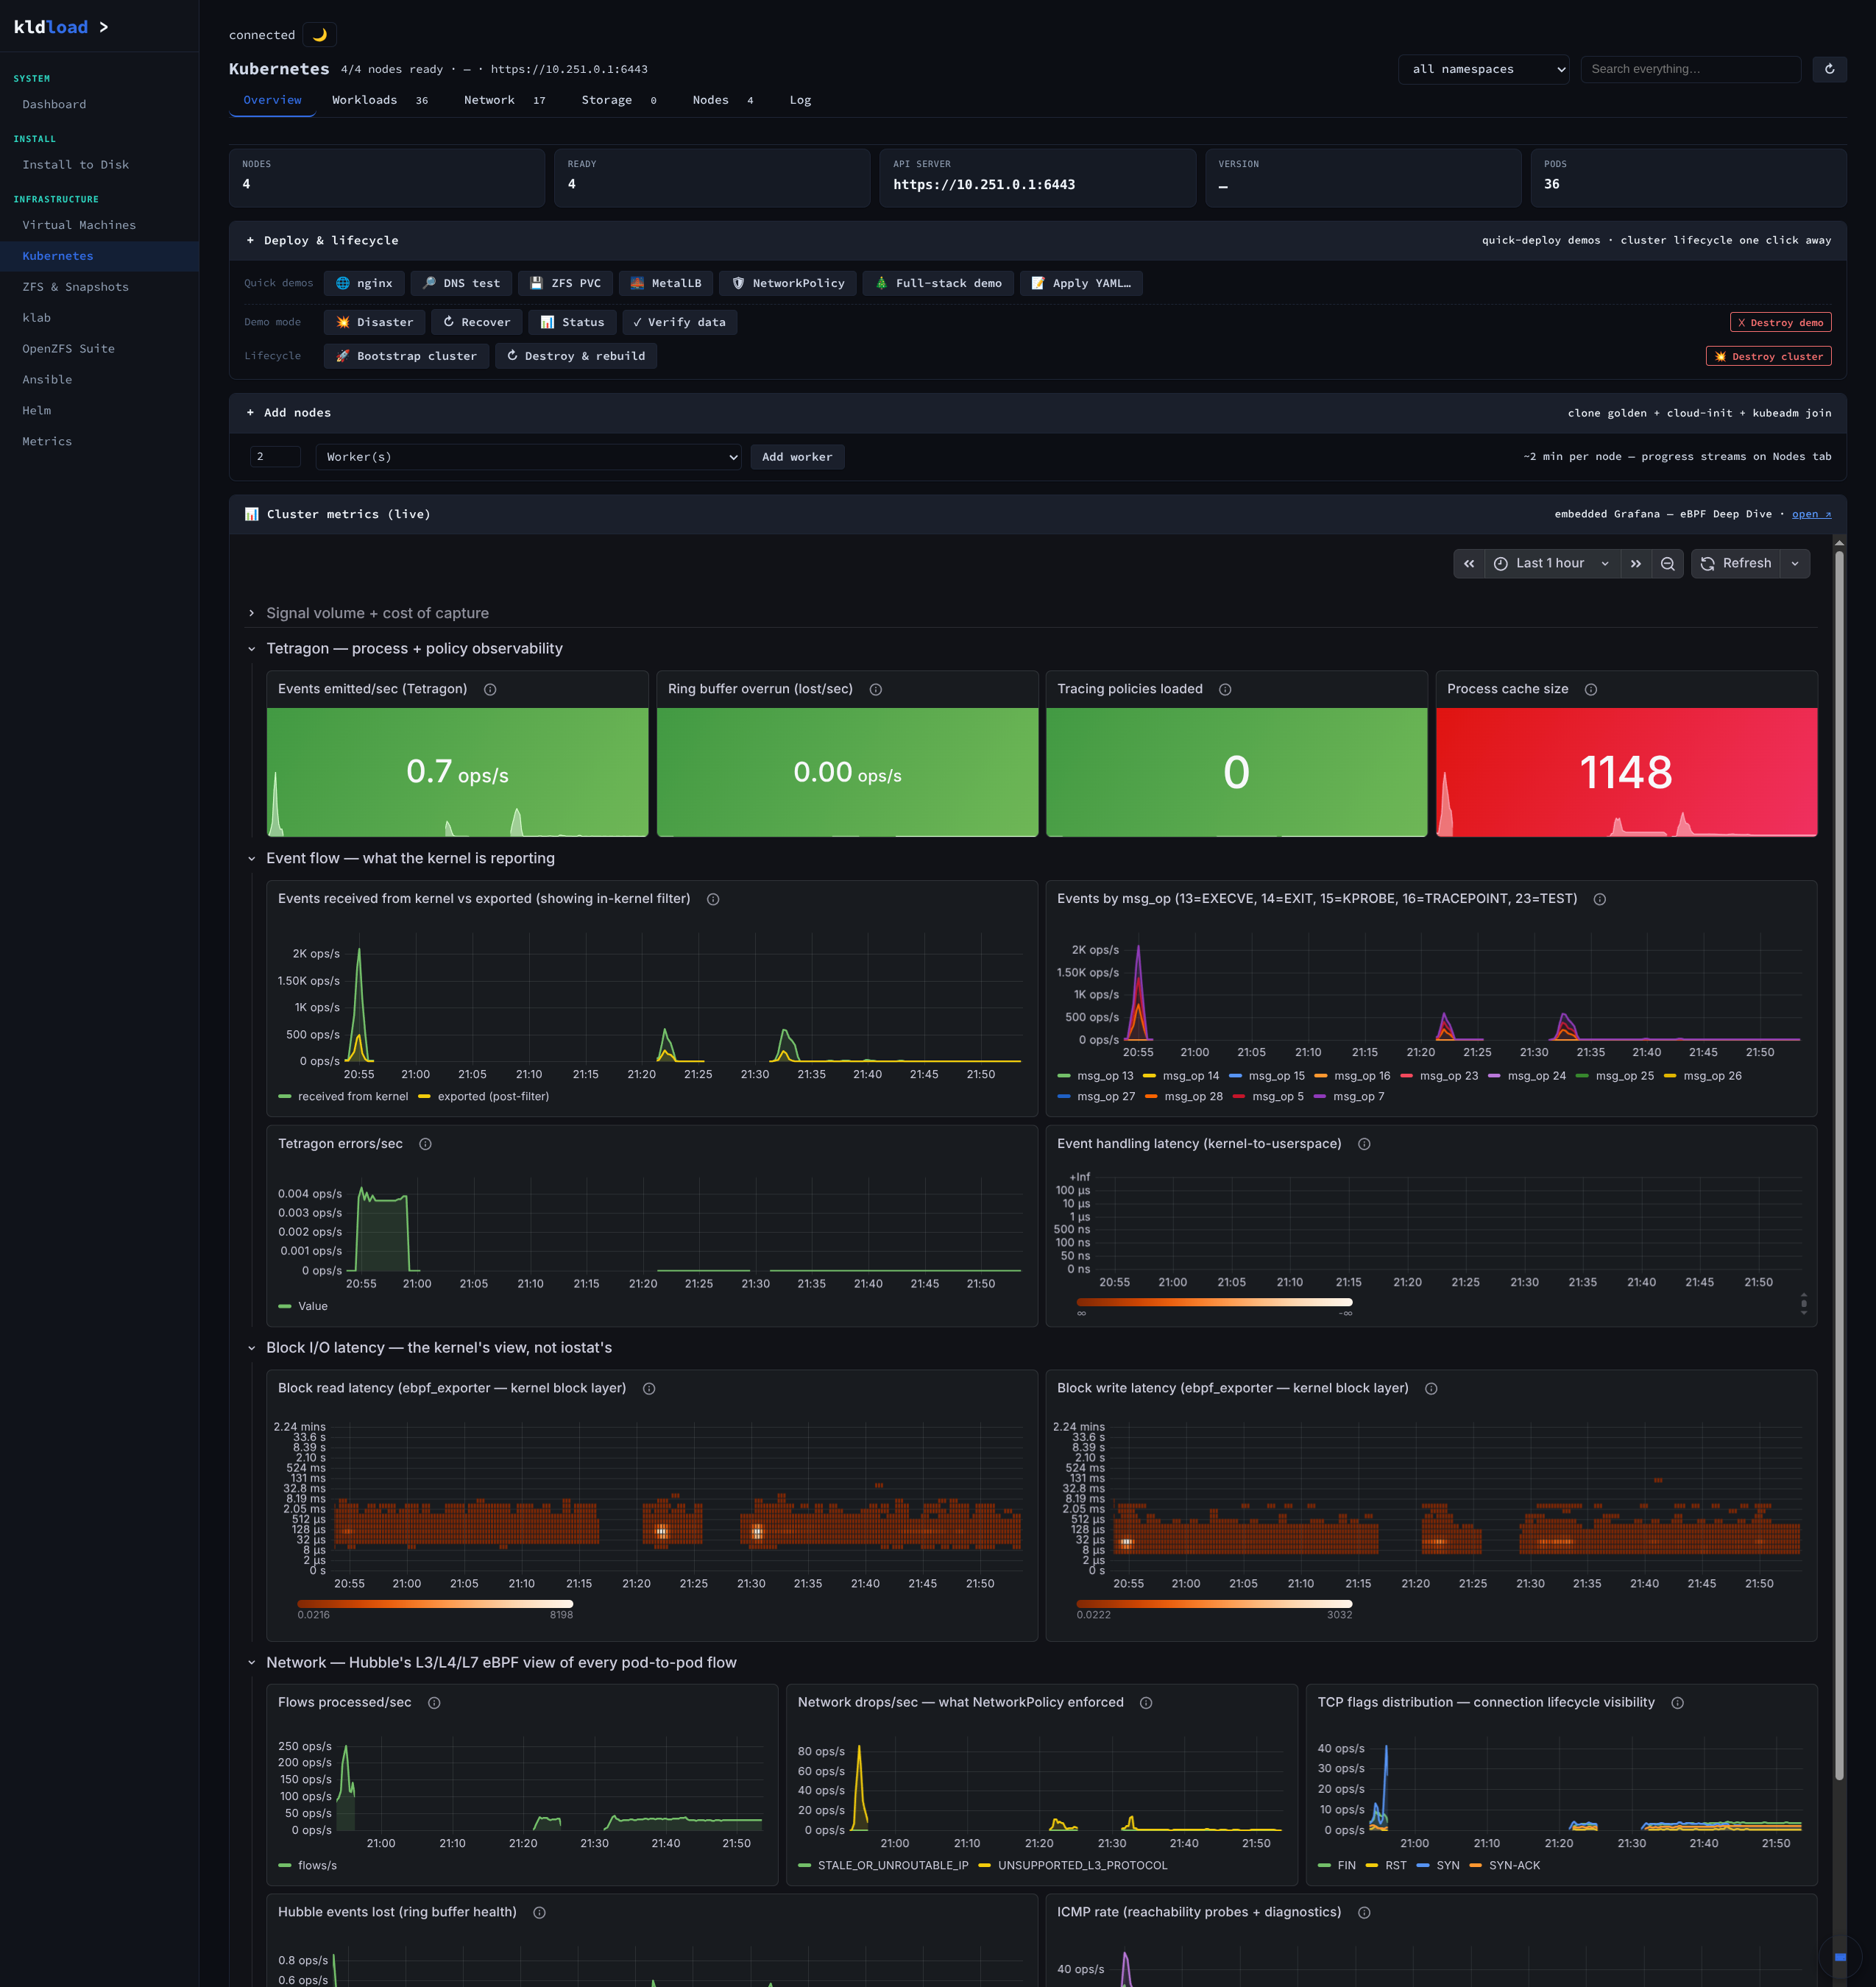
Point-and-shoot Kubernetes. Boot, deploy, giddy up. Full cluster baked in — control plane, workers, Cilium eBPF doing every pod packet in the kernel with no kube-proxy and no iptables rules to scroll through. Persistent volumes are ZFS clones — provision a 50 GB PV in eleven milliseconds. Hubble flow visibility live, no APM agent. Tetragon syscall-level process tracing across every container.
Ever suddenly get the urge to deploy a 10-node, 5,000-pod Kubernetes cluster? Now you can, in about twenty minutes. The gap between wanting the cluster and having the cluster collapsed from a planning meeting to a coffee break the day someone stopped pretending each consumer needed its own machinery.
Overview, workloads, network, storage, nodes
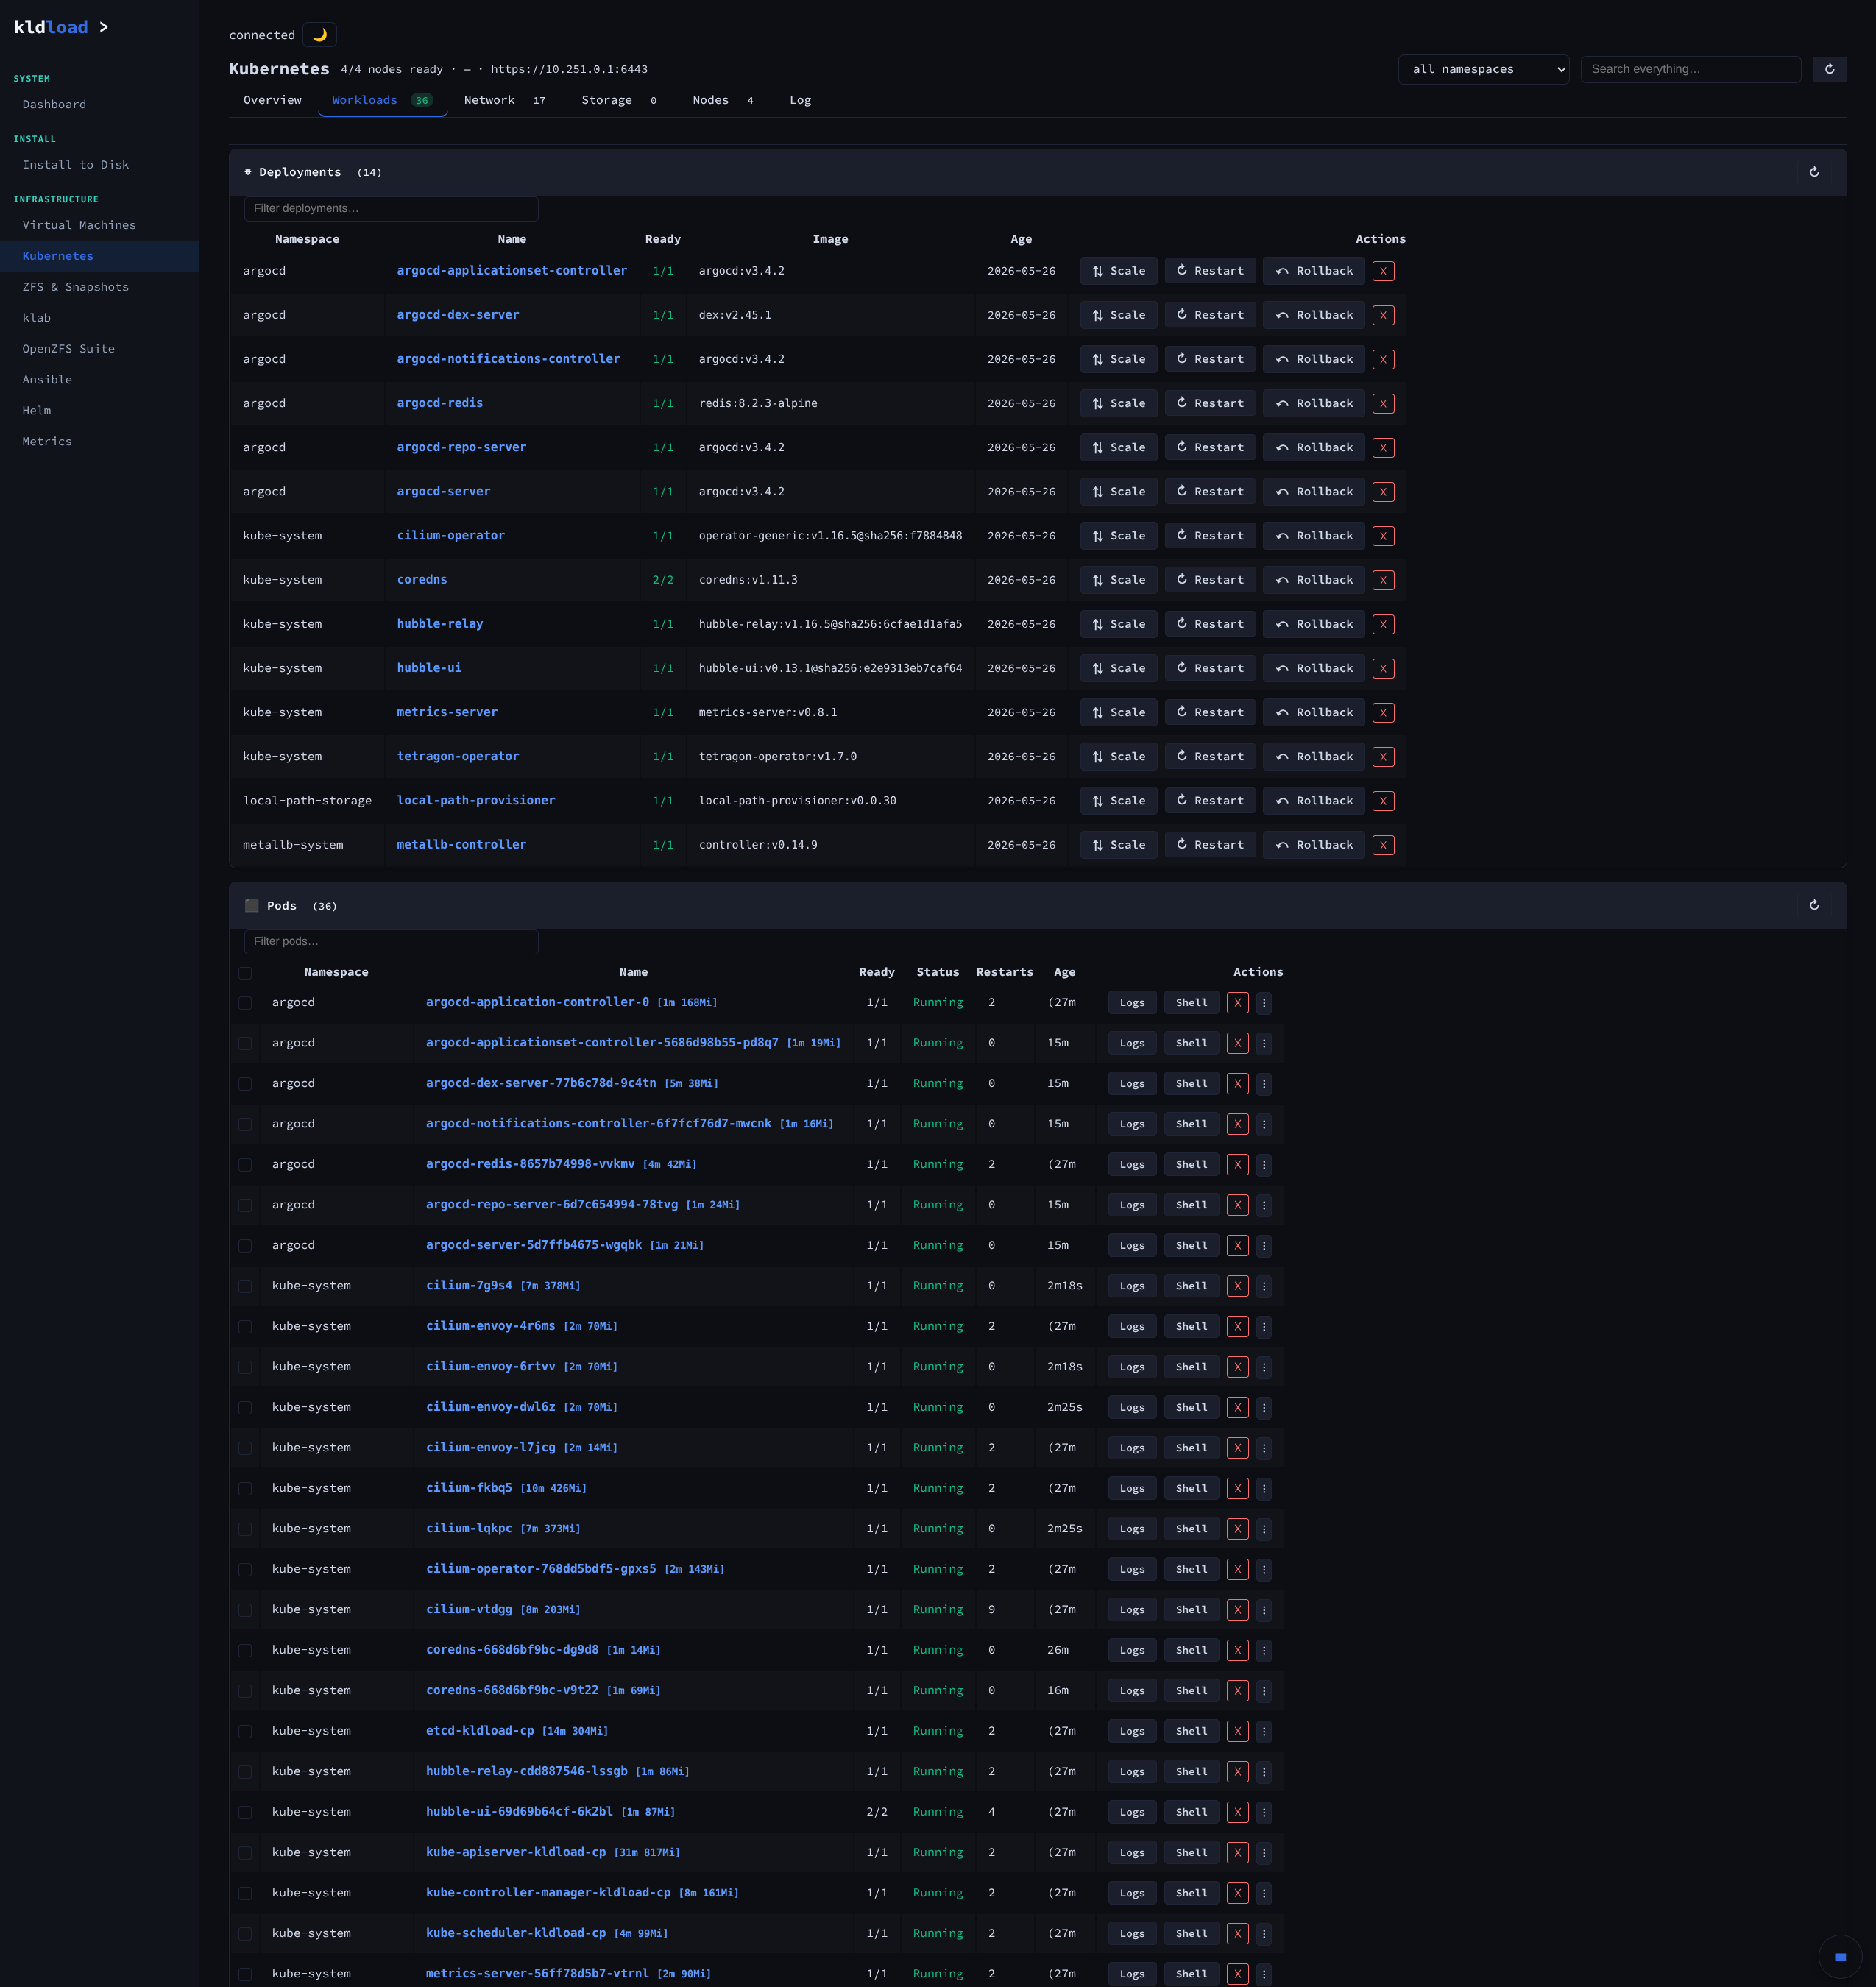
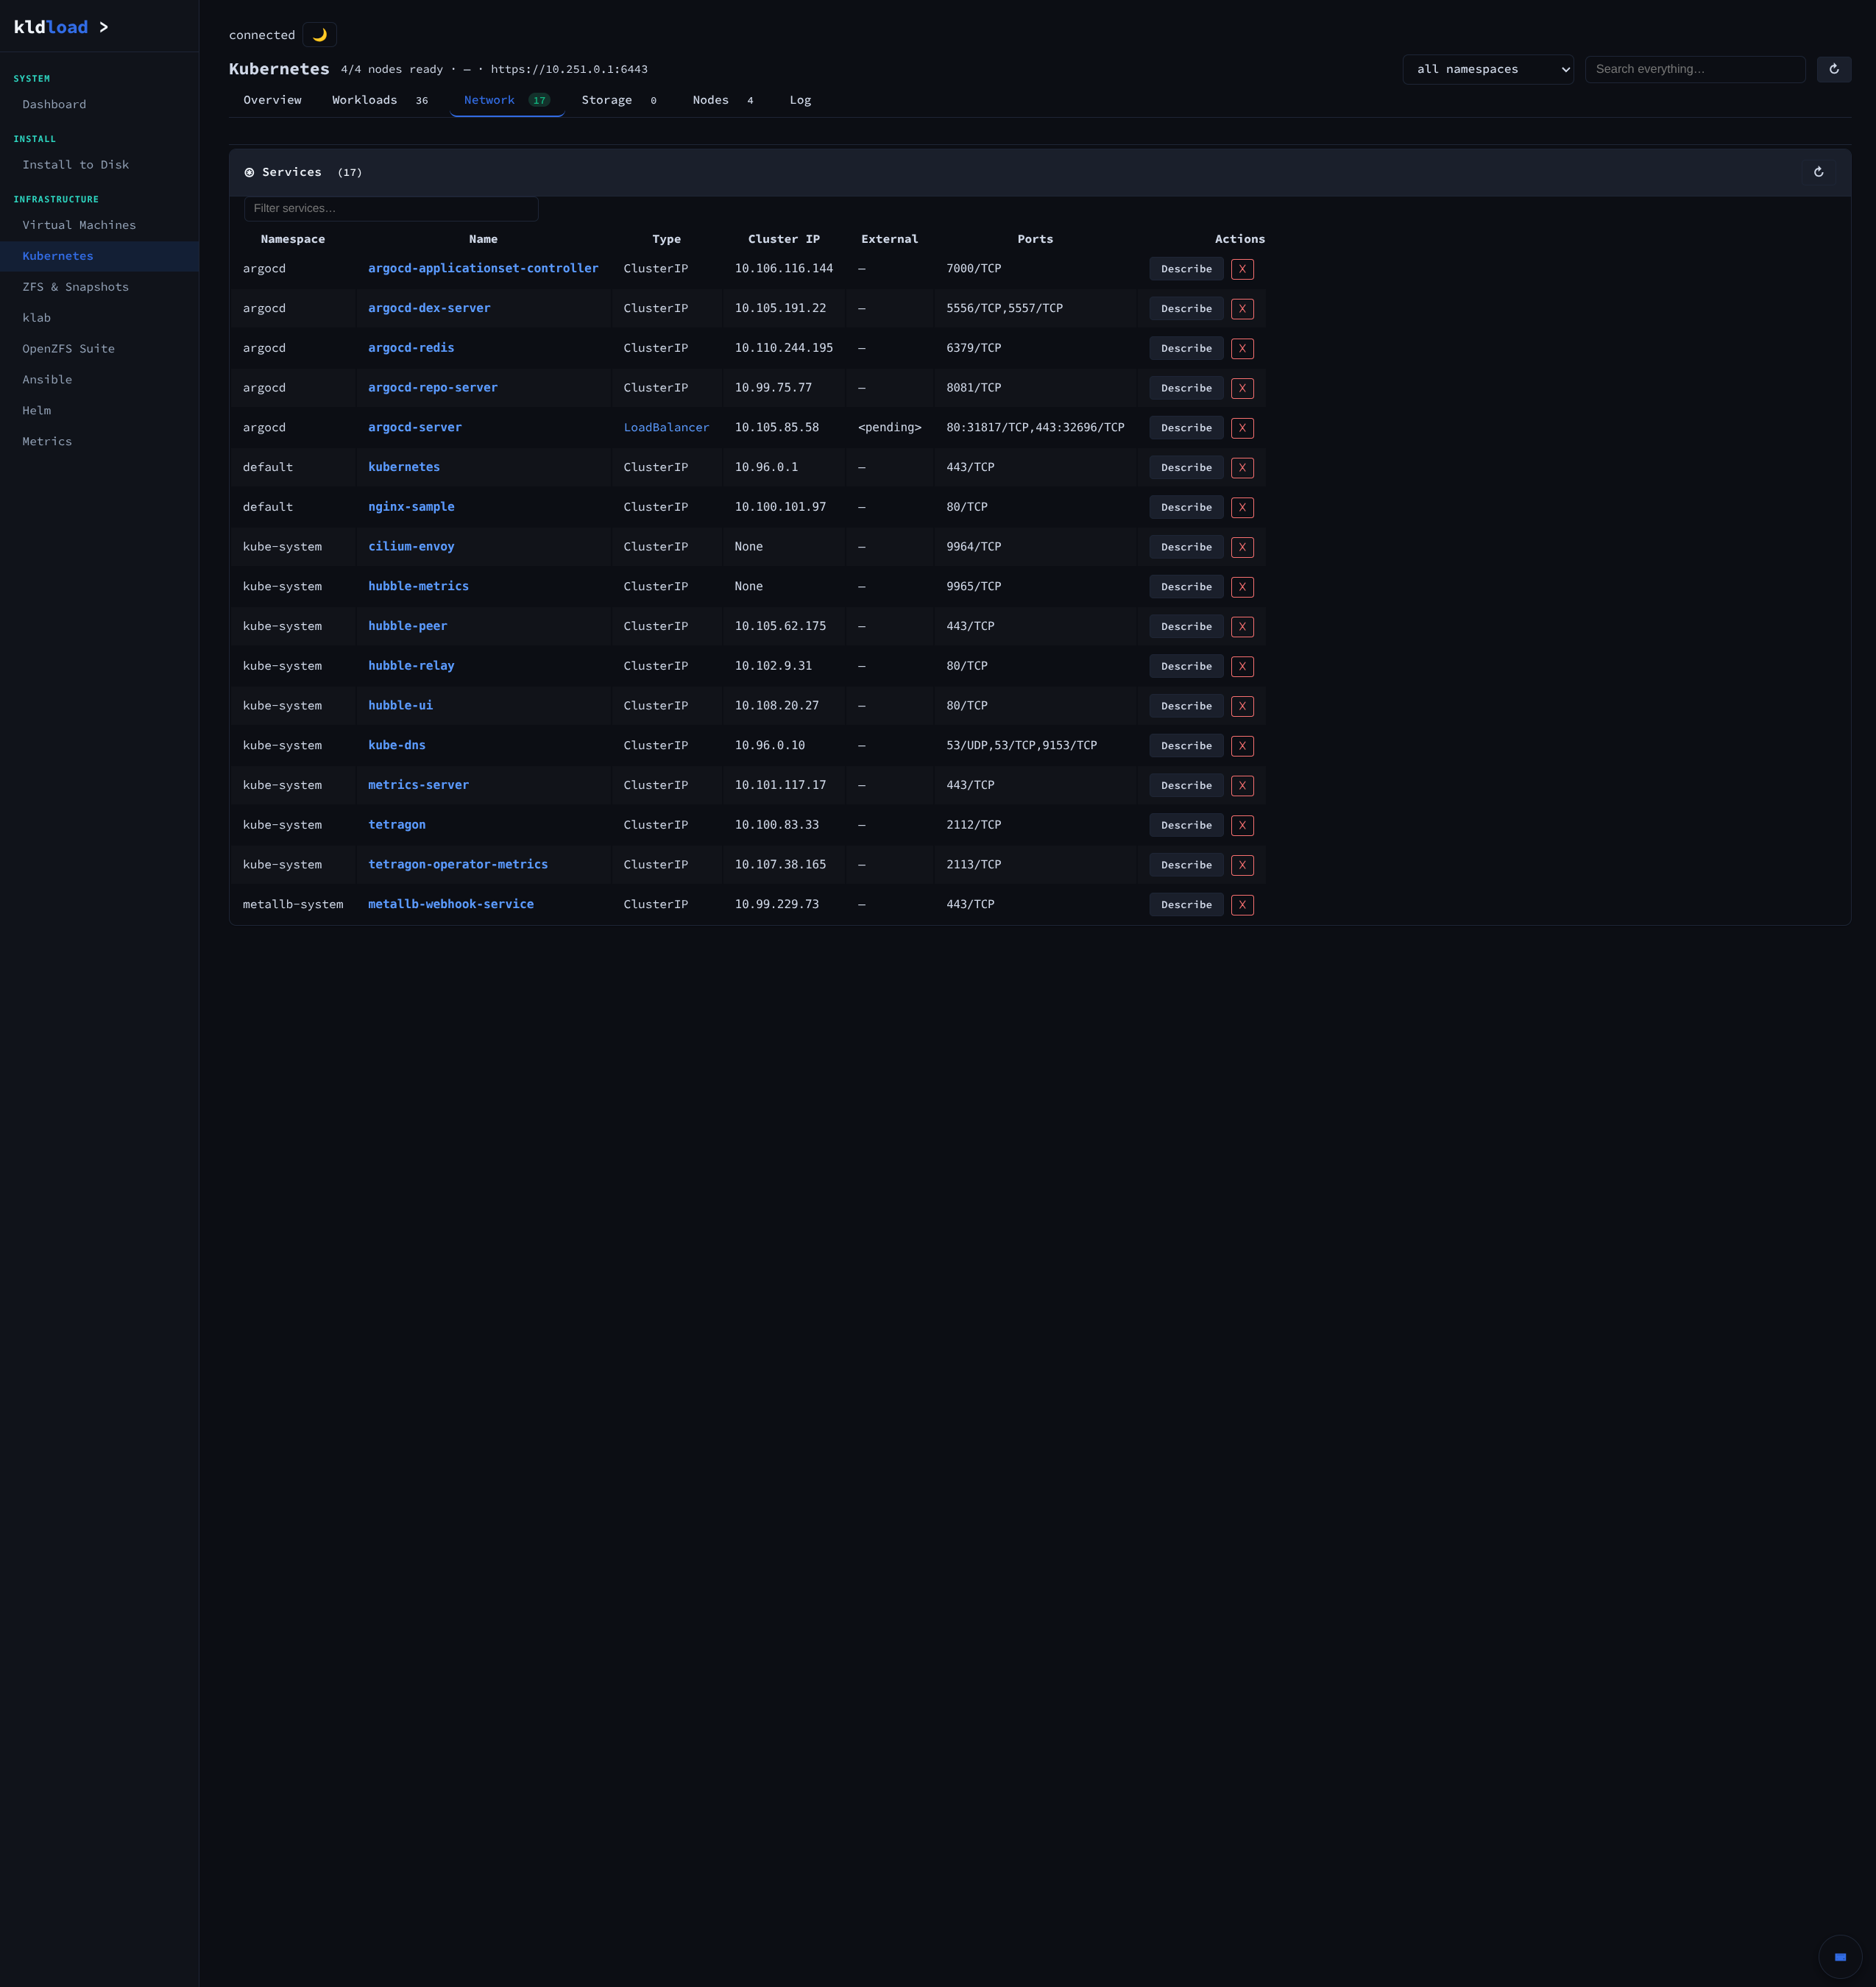
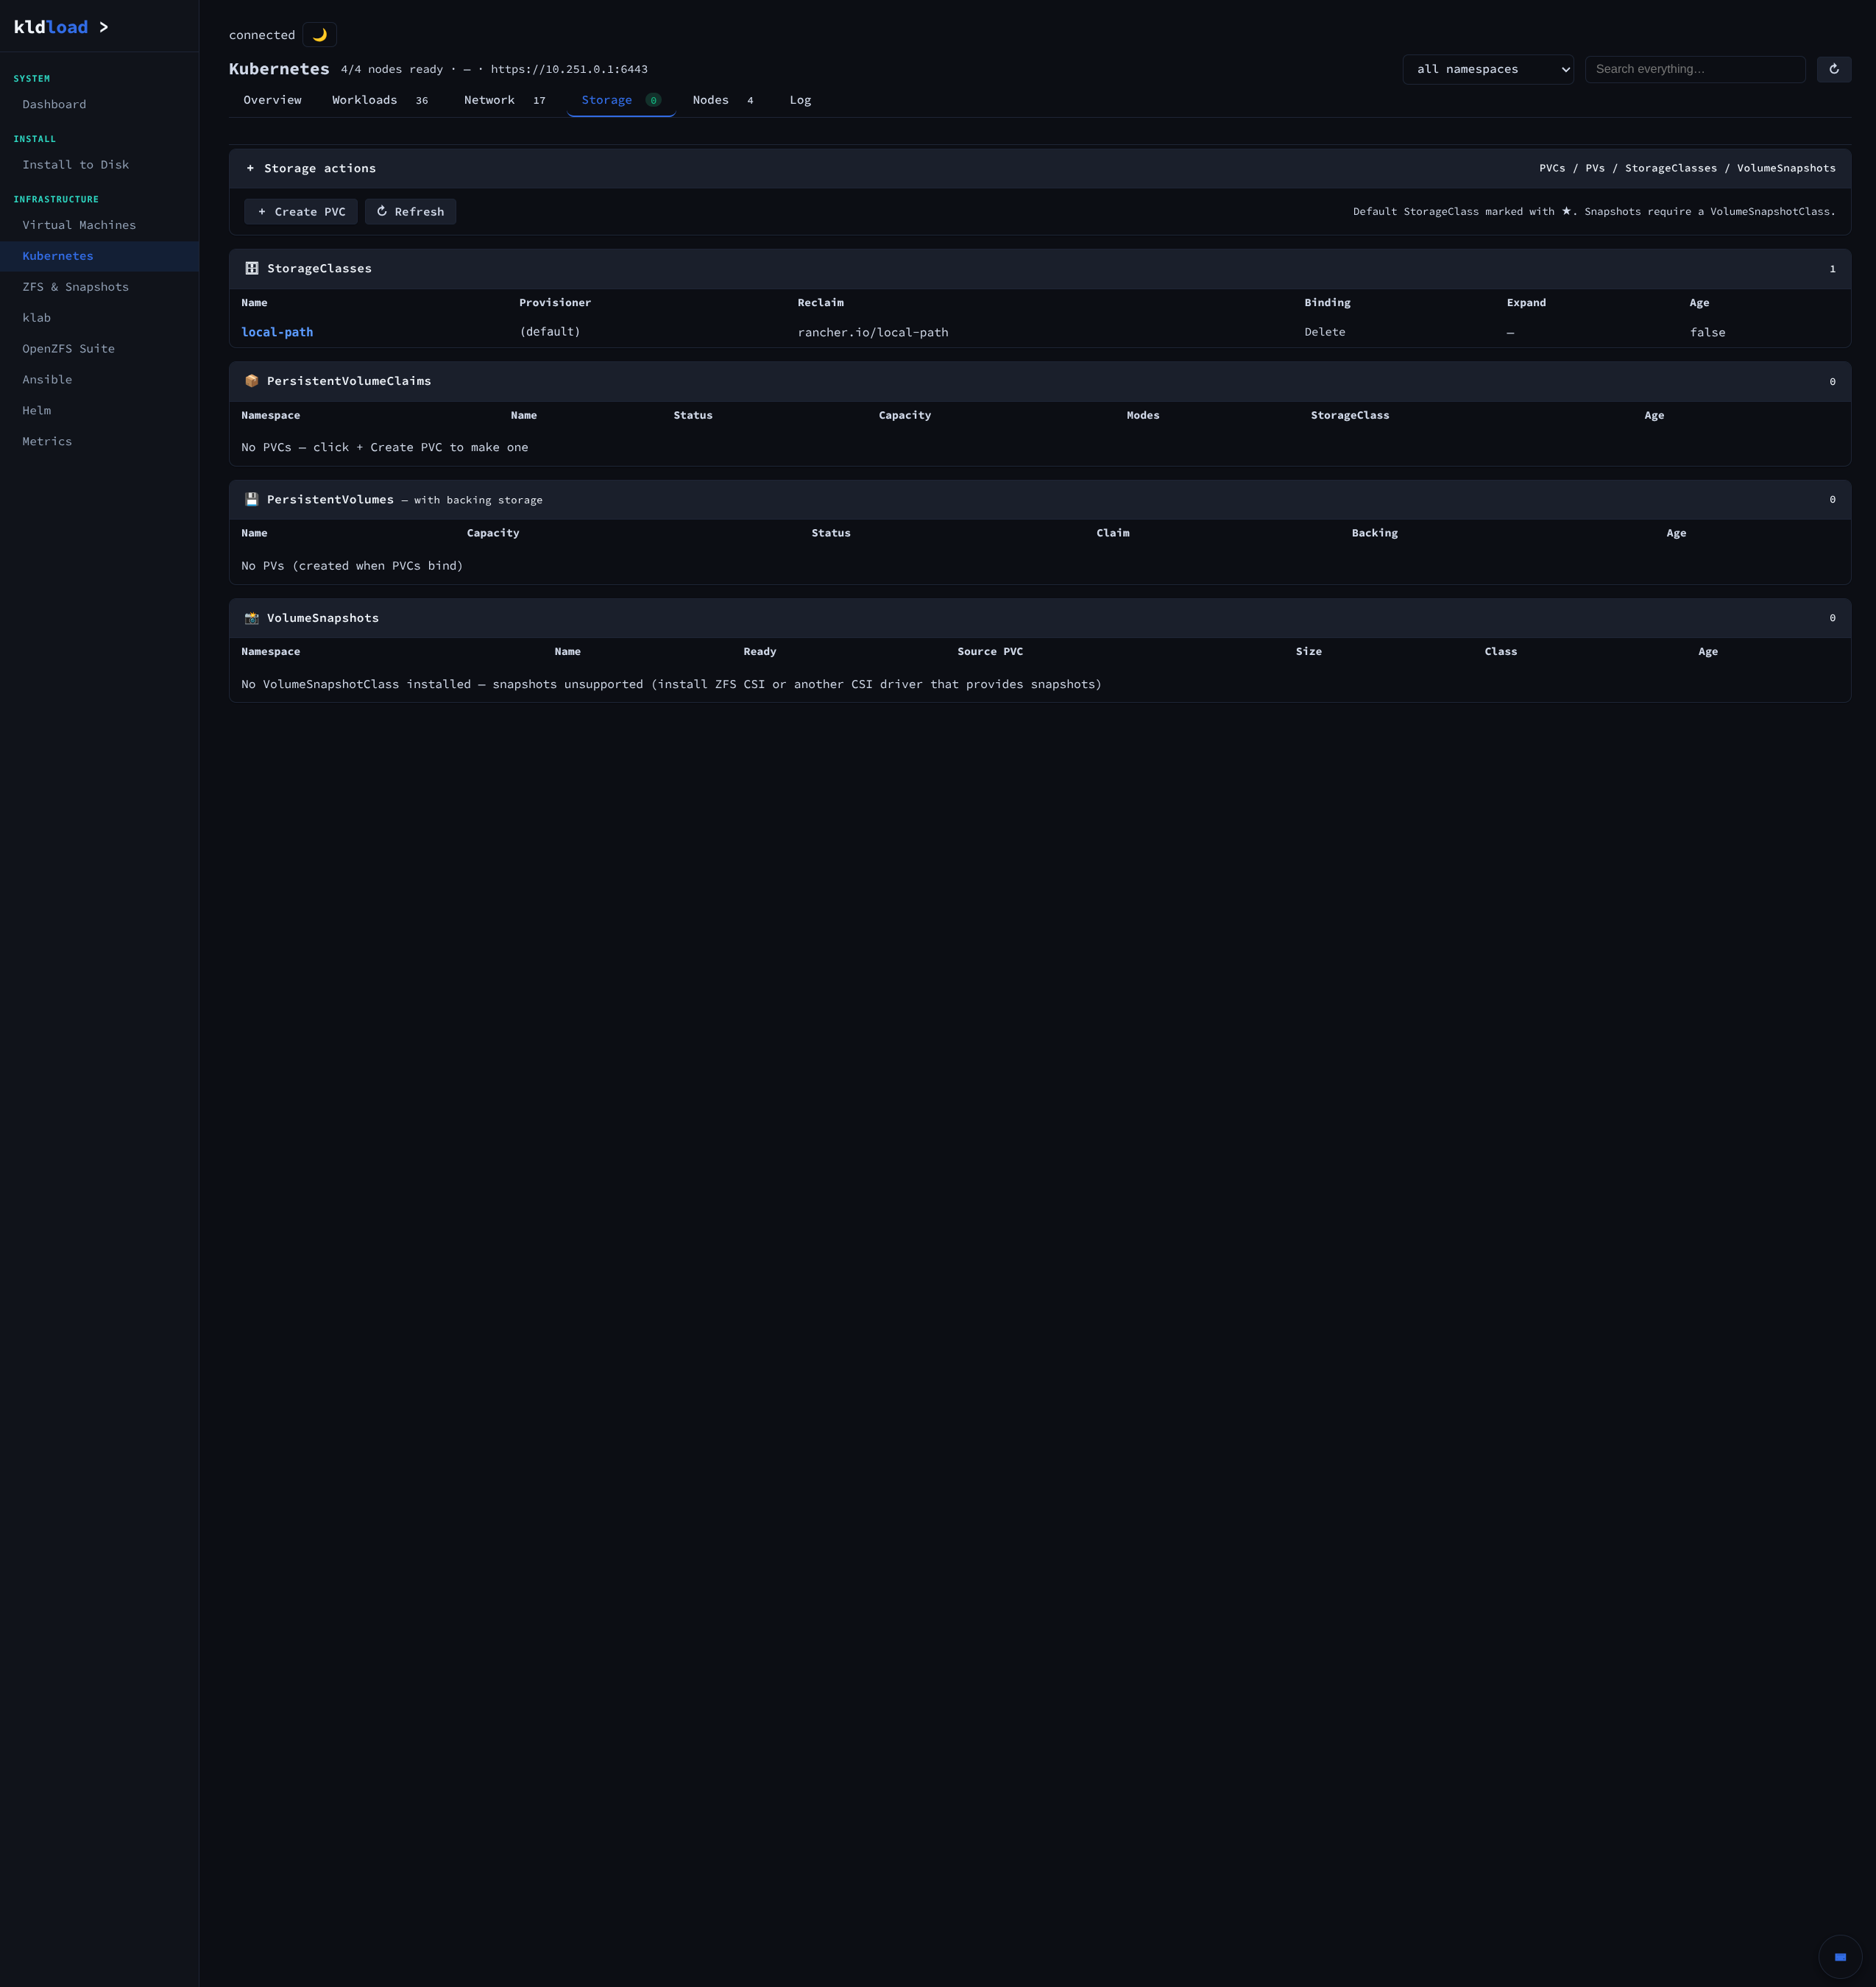
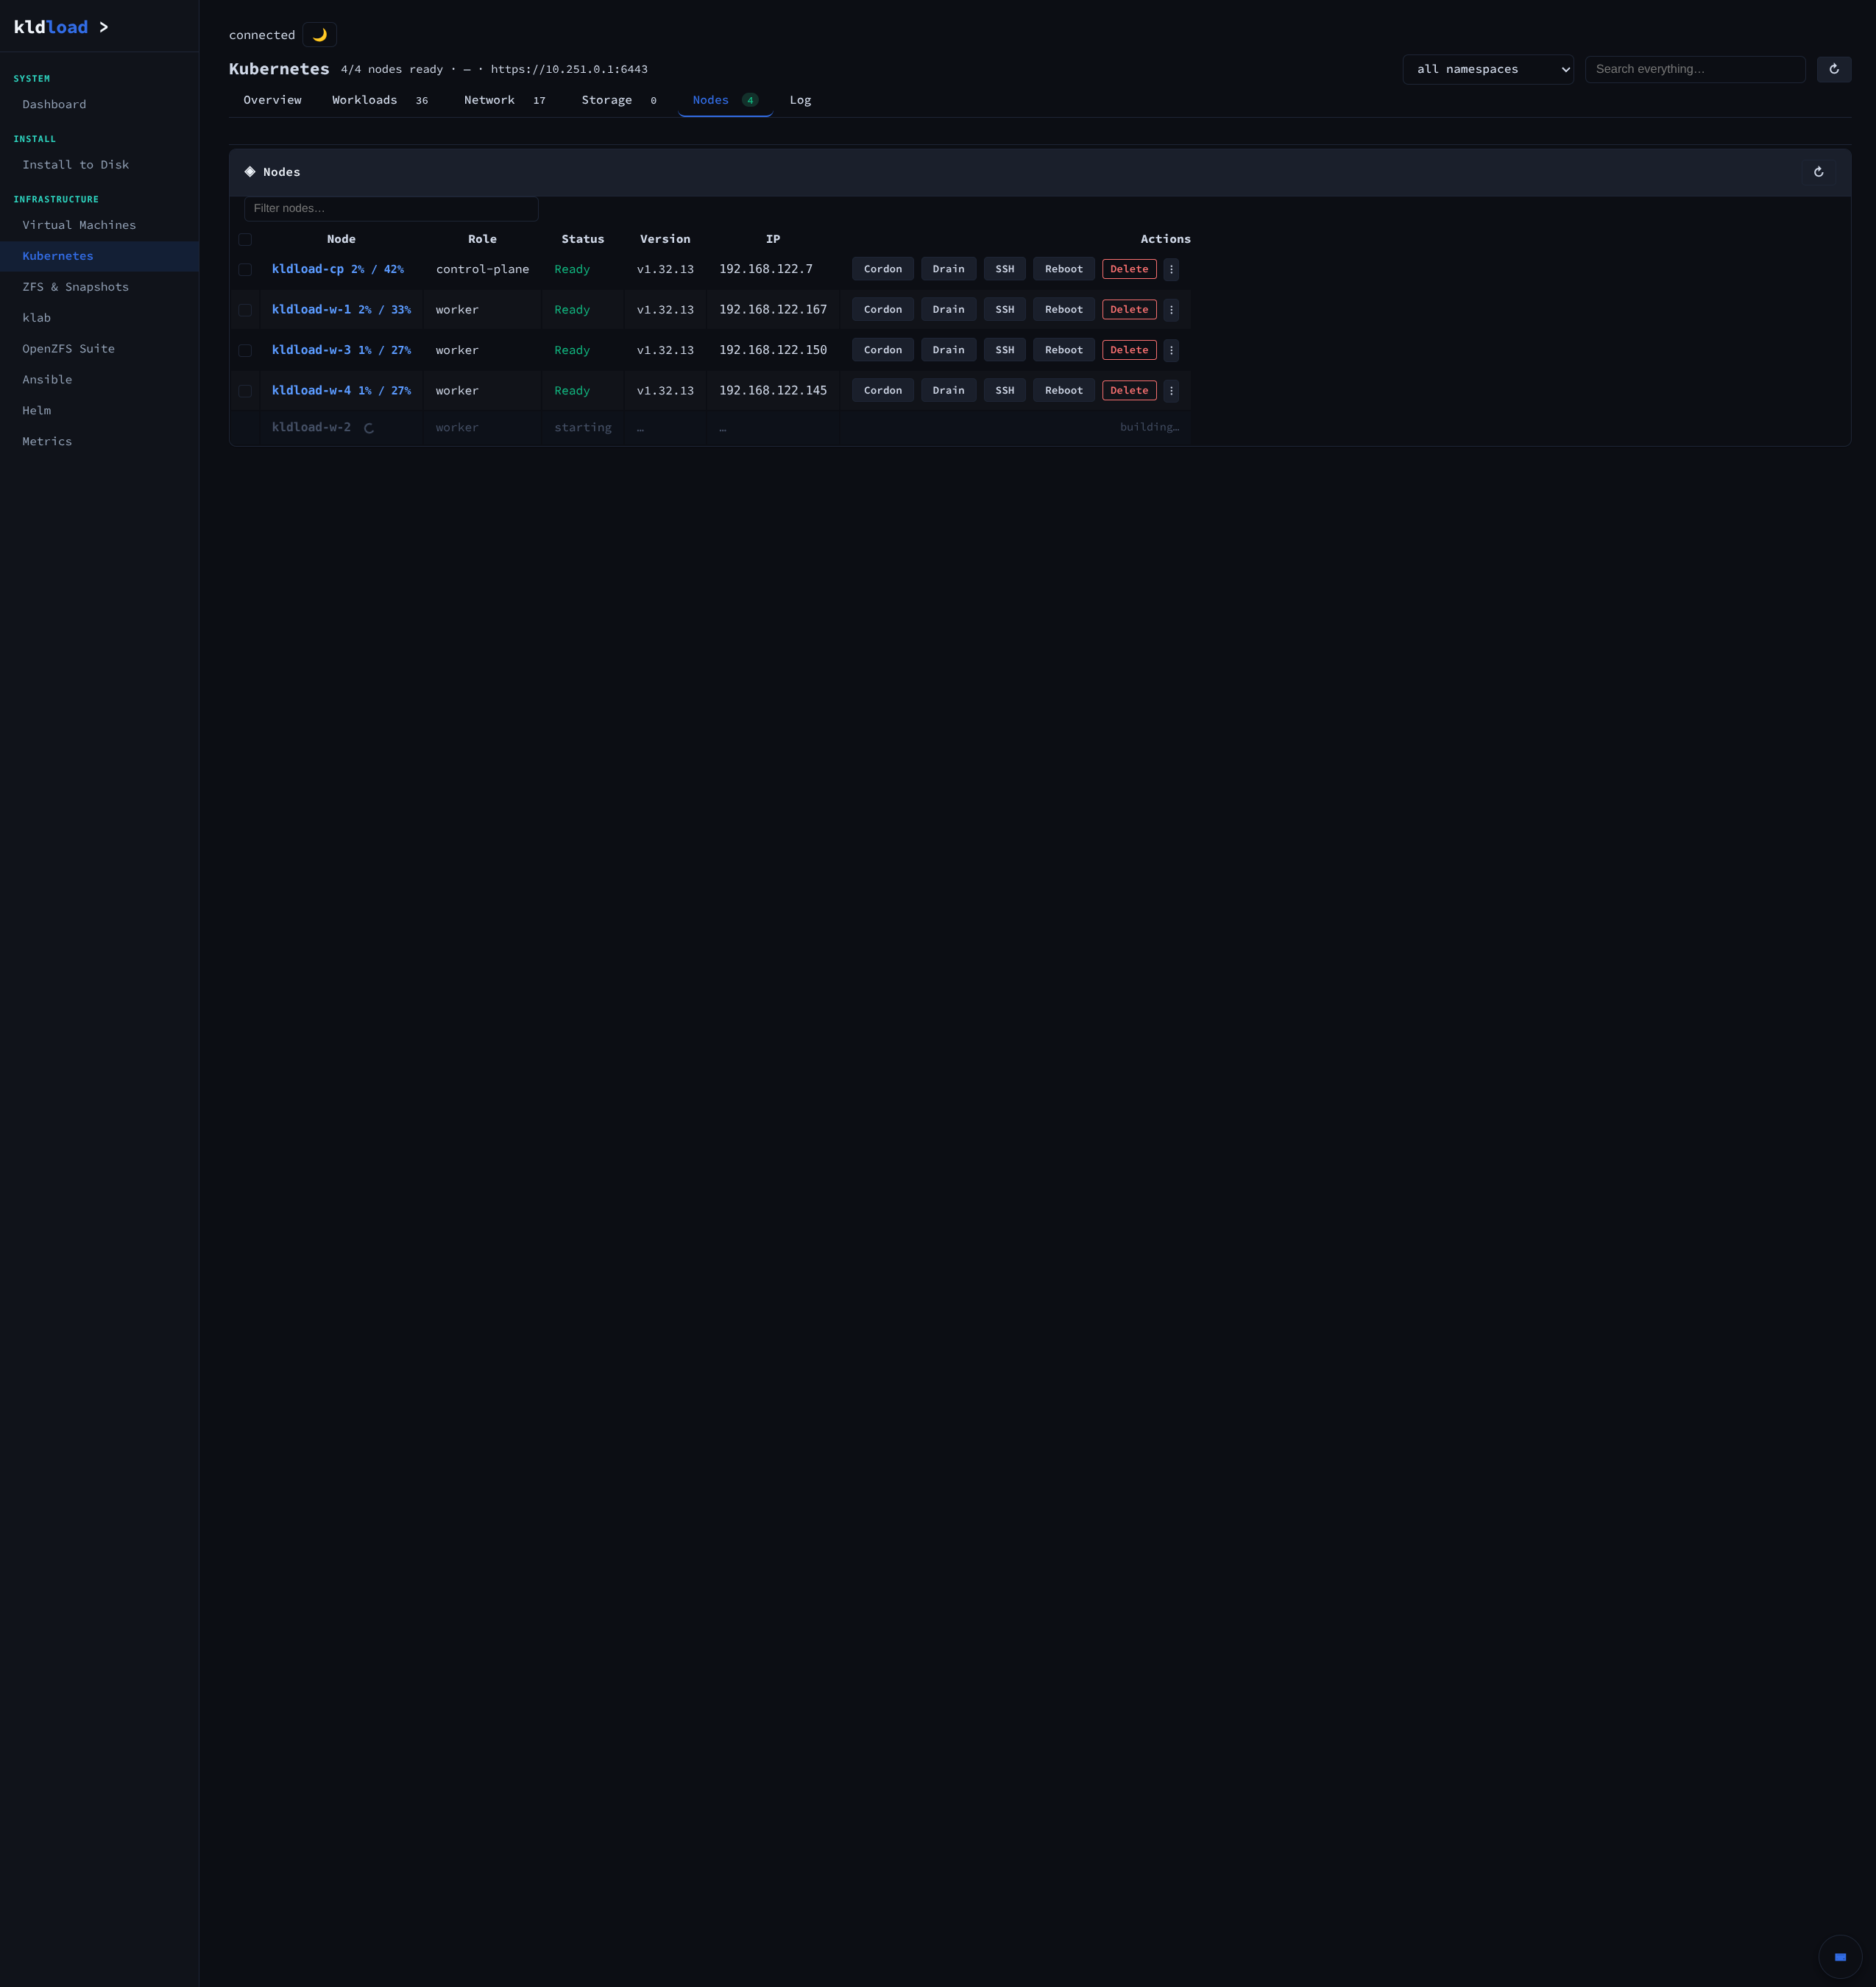
Overview (Tetragon + Hubble + syscall panels live), Workloads (every deployment + pod across every namespace), Network (services, ingress, the whole eBPF datapath), Storage (PVCs, PVs, StorageClasses, VolumeSnapshots), Nodes (control plane + workers with CPU/RAM, IP, kubelet version).
Console — point-and-shoot tmux power
Every observability surface that has its own dashboard on the rest of this page also has a console cockpit one keypress away. Hit F5 and a four-pane disk-I/O view opens — biosnoop, biolatency, fileslower, zfsdist all updating live. F6 gives five panes of syscall tracing. F7 for TCP. F9 for the in-kernel-everything dashboard. F11 for Hubble + Tetragon + tracingpol + kernel-log. Press the same F-key again to close. F1 any time redraws the cheatsheet in place — no popup, no nav away.
Under the hood it’s tmux with a deliberate F-key layer wrapped around it. You get the full power — Shift+←/→ to move between windows, Ctrl+Q to close the active cockpit, normal browser copy/paste — without ever needing to memorize tmux’s two-character chord syntax. It’s a curated terminal: every cockpit was built by someone who already lost an afternoon wiring those tools up by hand.
Keymap — the whole map fits in two lines
F1 help ·
F2 k9s ·
F3 unified log tail ·
F4 webui+ttyd journal ·
F5 disk bcc ·
F6 syscall bcc ·
F7 TCP bcc ·
F8 Cilium state ·
F9 htop ·
F10 ZFS group ·
F11 tracing ·
F12 kernel-stress (PSI+runqlat+softirqs+hardirqs+bpf-prog)
Shift+F2 k8s events watch ·
Shift+F3 root shell ·
Shift+F4 dmesg follow ·
Shift+F5 kldload-doctor watch ·
Shift+F6 iotop
Shift+←/→ navigate windows ·
Ctrl+Q close active cockpit ·
mouse-select + Ctrl+C / Ctrl+V for copy / paste
Cockpits — one xray per F-key
Each cockpit is a different flavor of xray vision — block I/O, syscalls, TCP, process state, distributed tracing. Same trick the rest of the platform uses (eBPF in the kernel, dashboards in userland) but landed in a terminal the moment you connect, not after you finished installing a sidecar. Shots below.
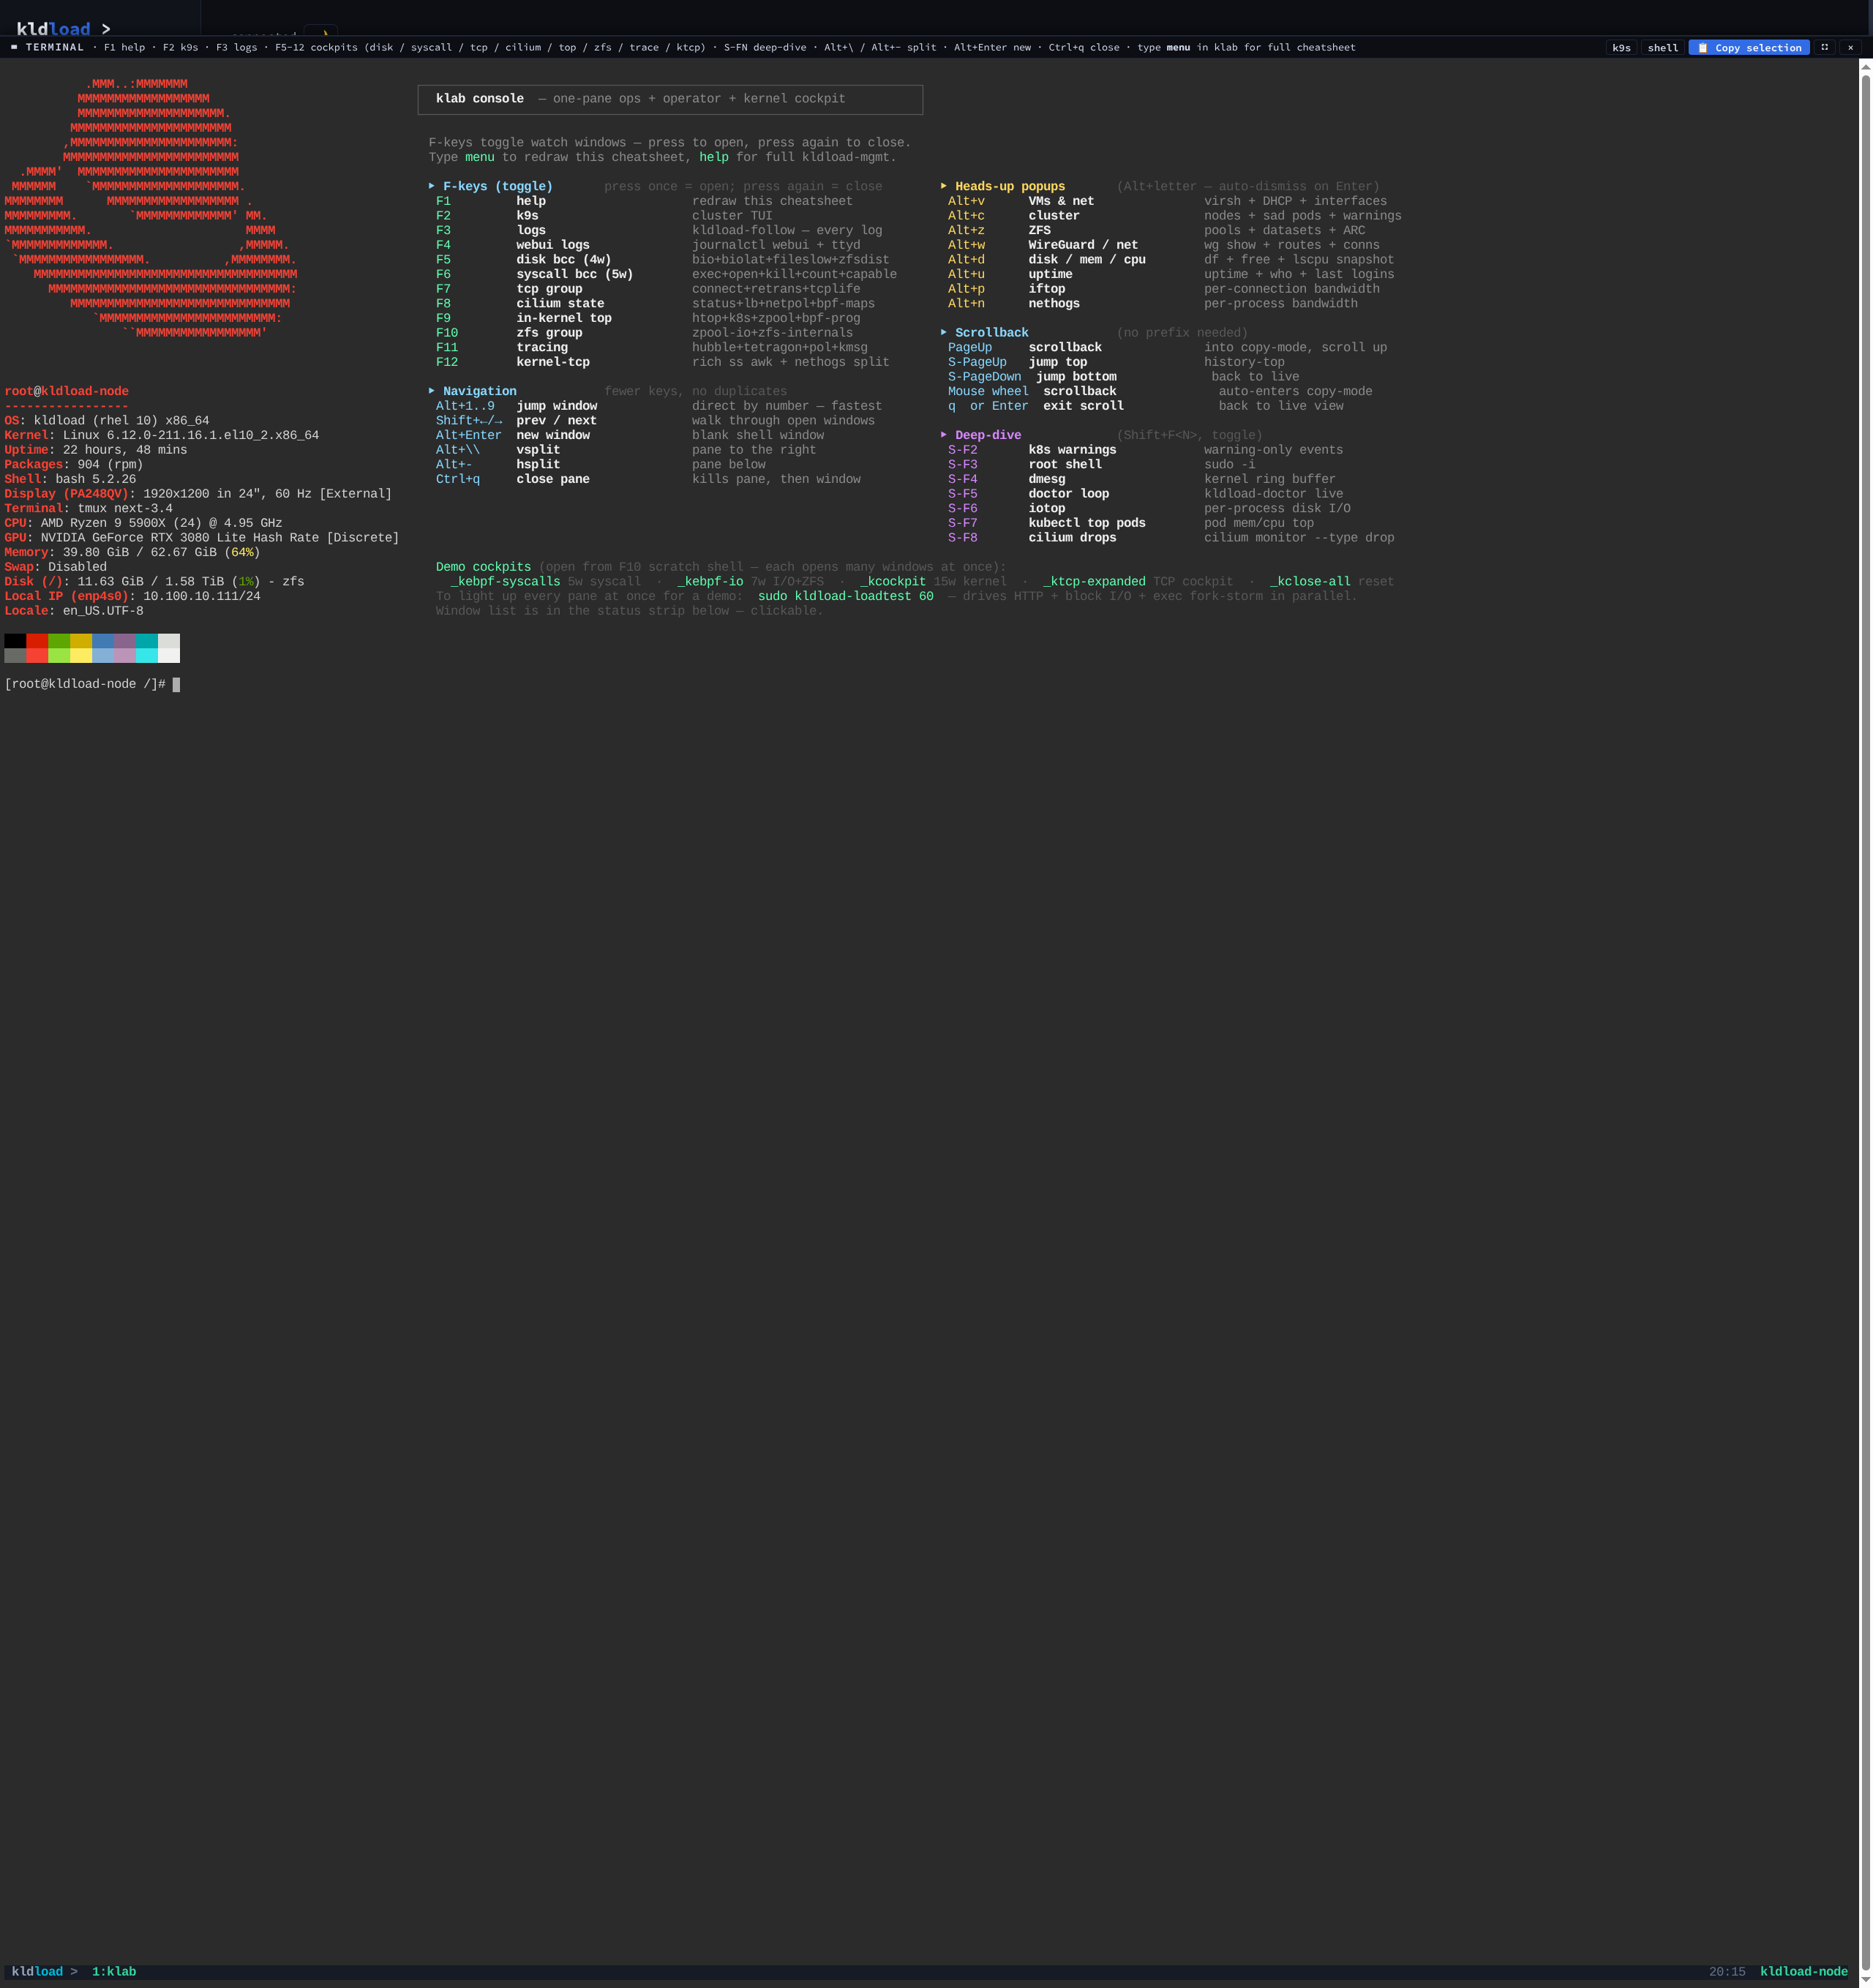
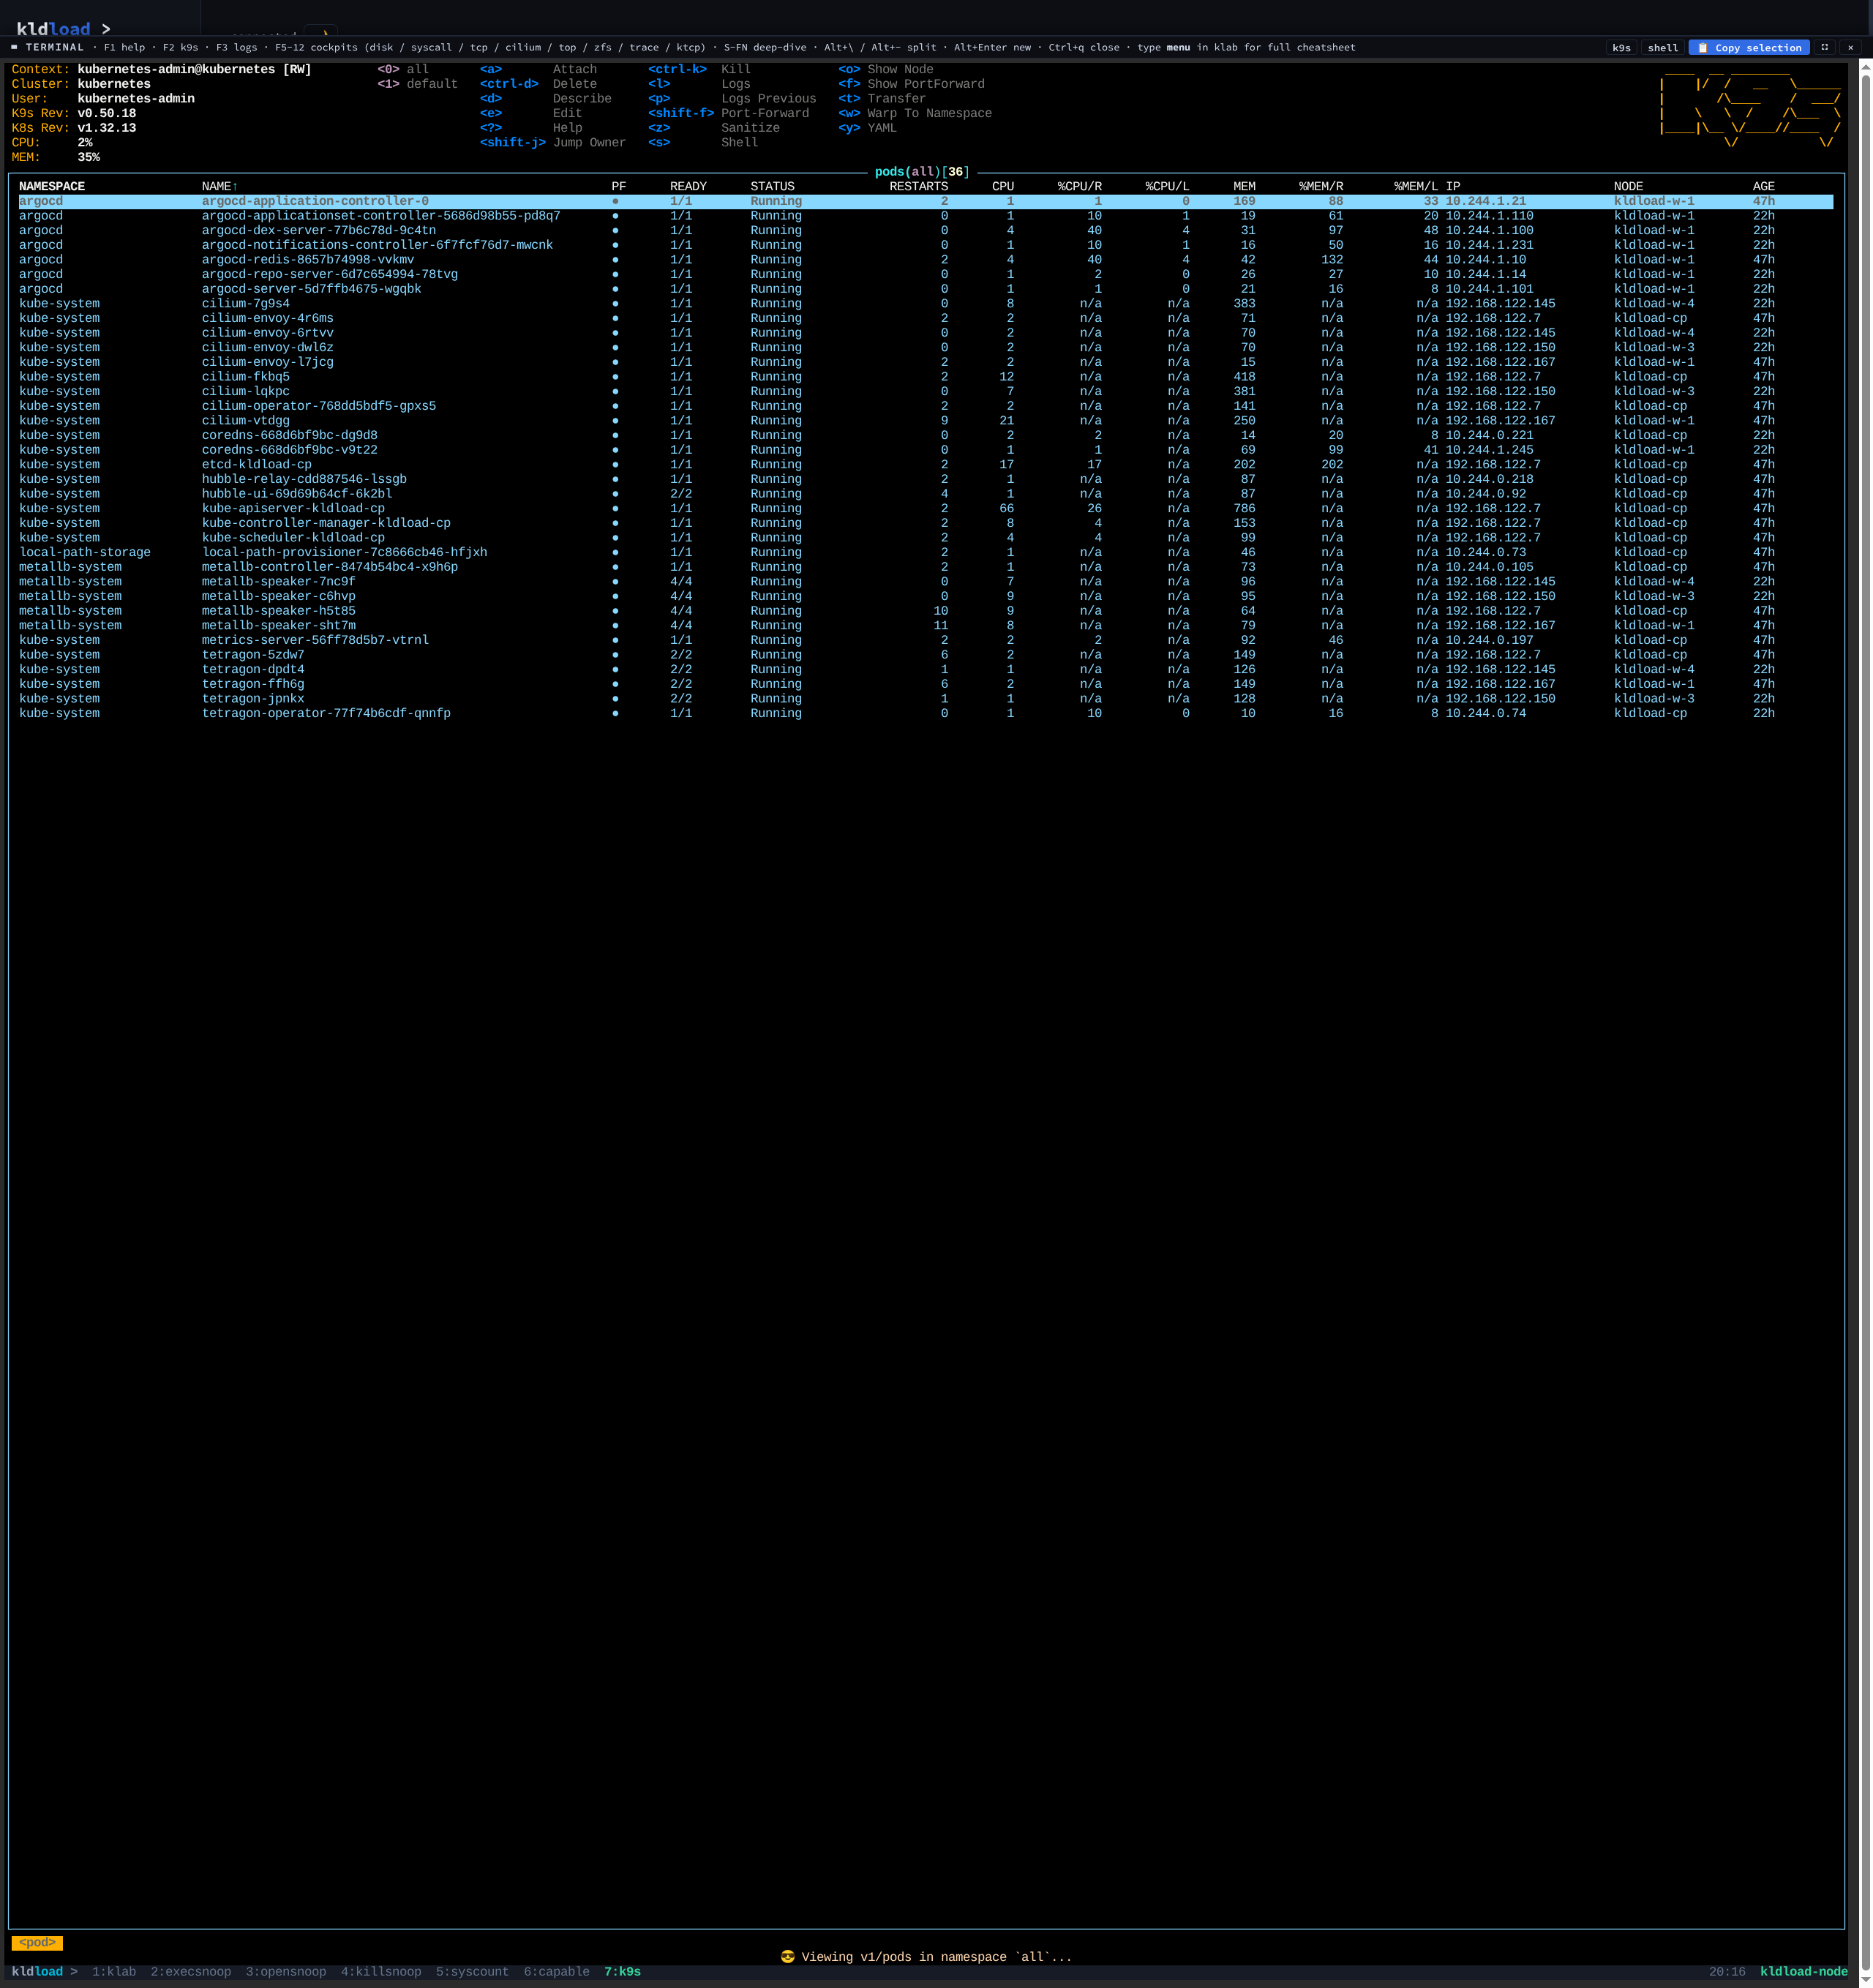
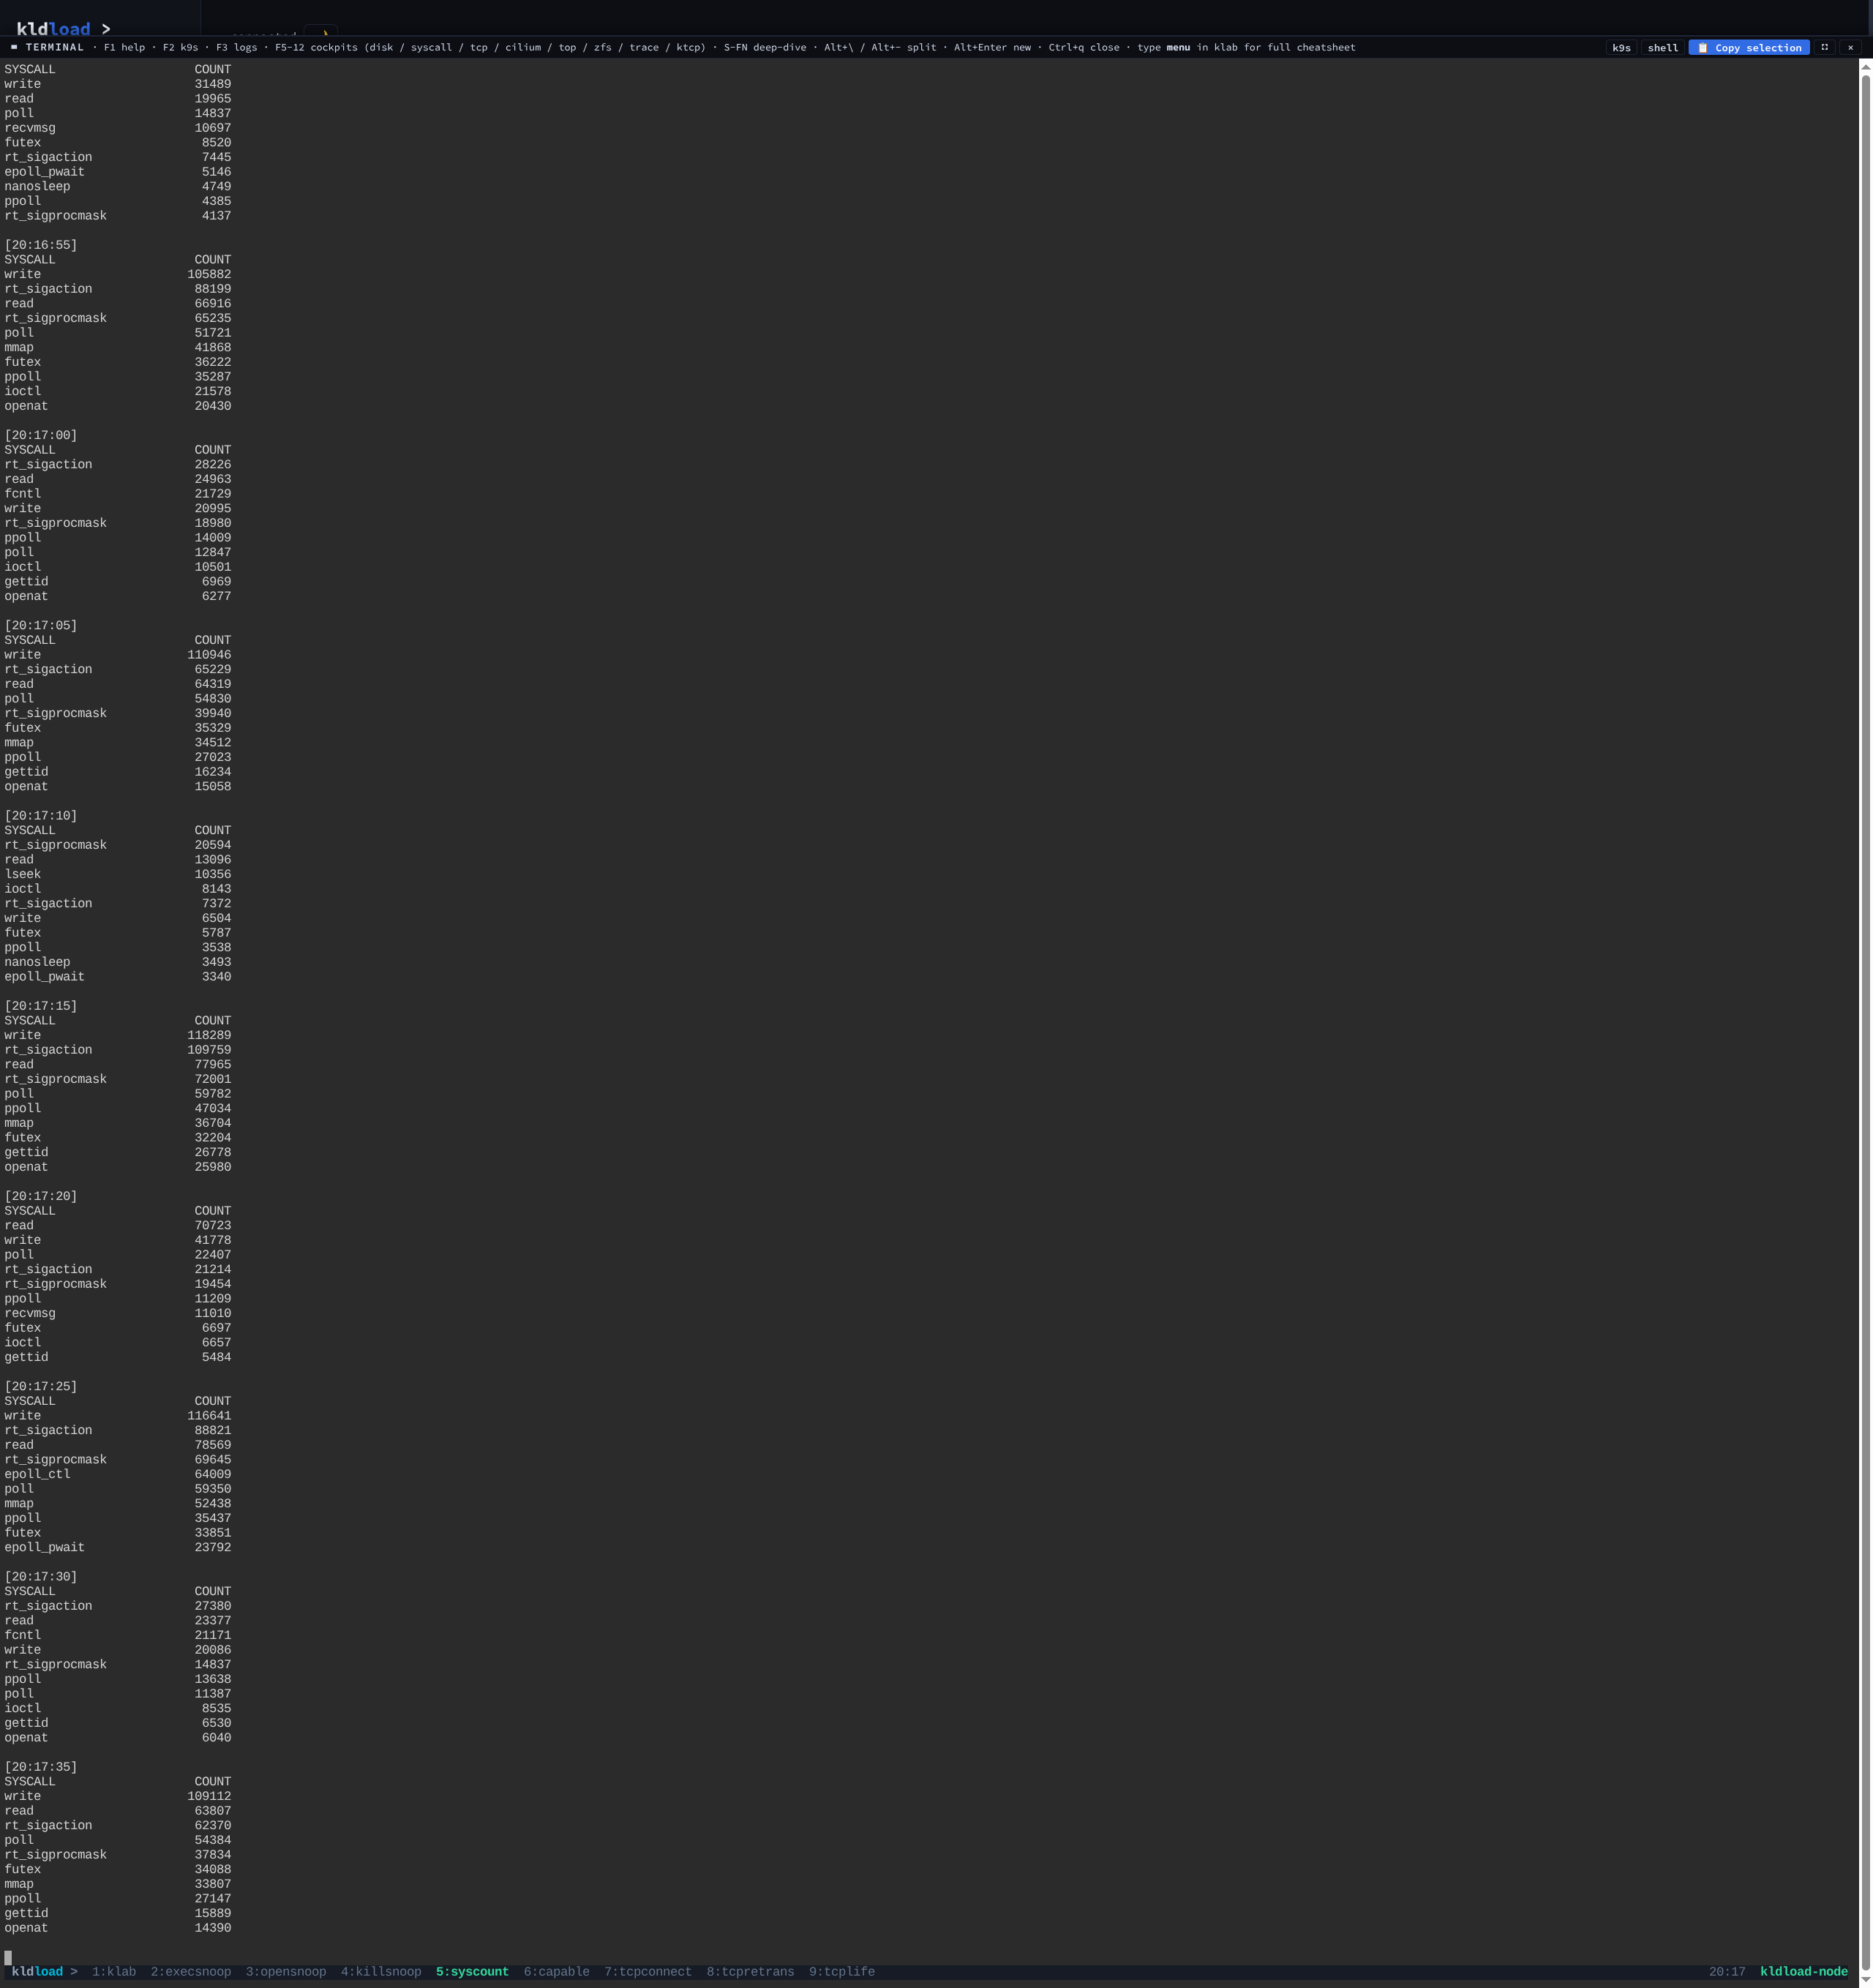
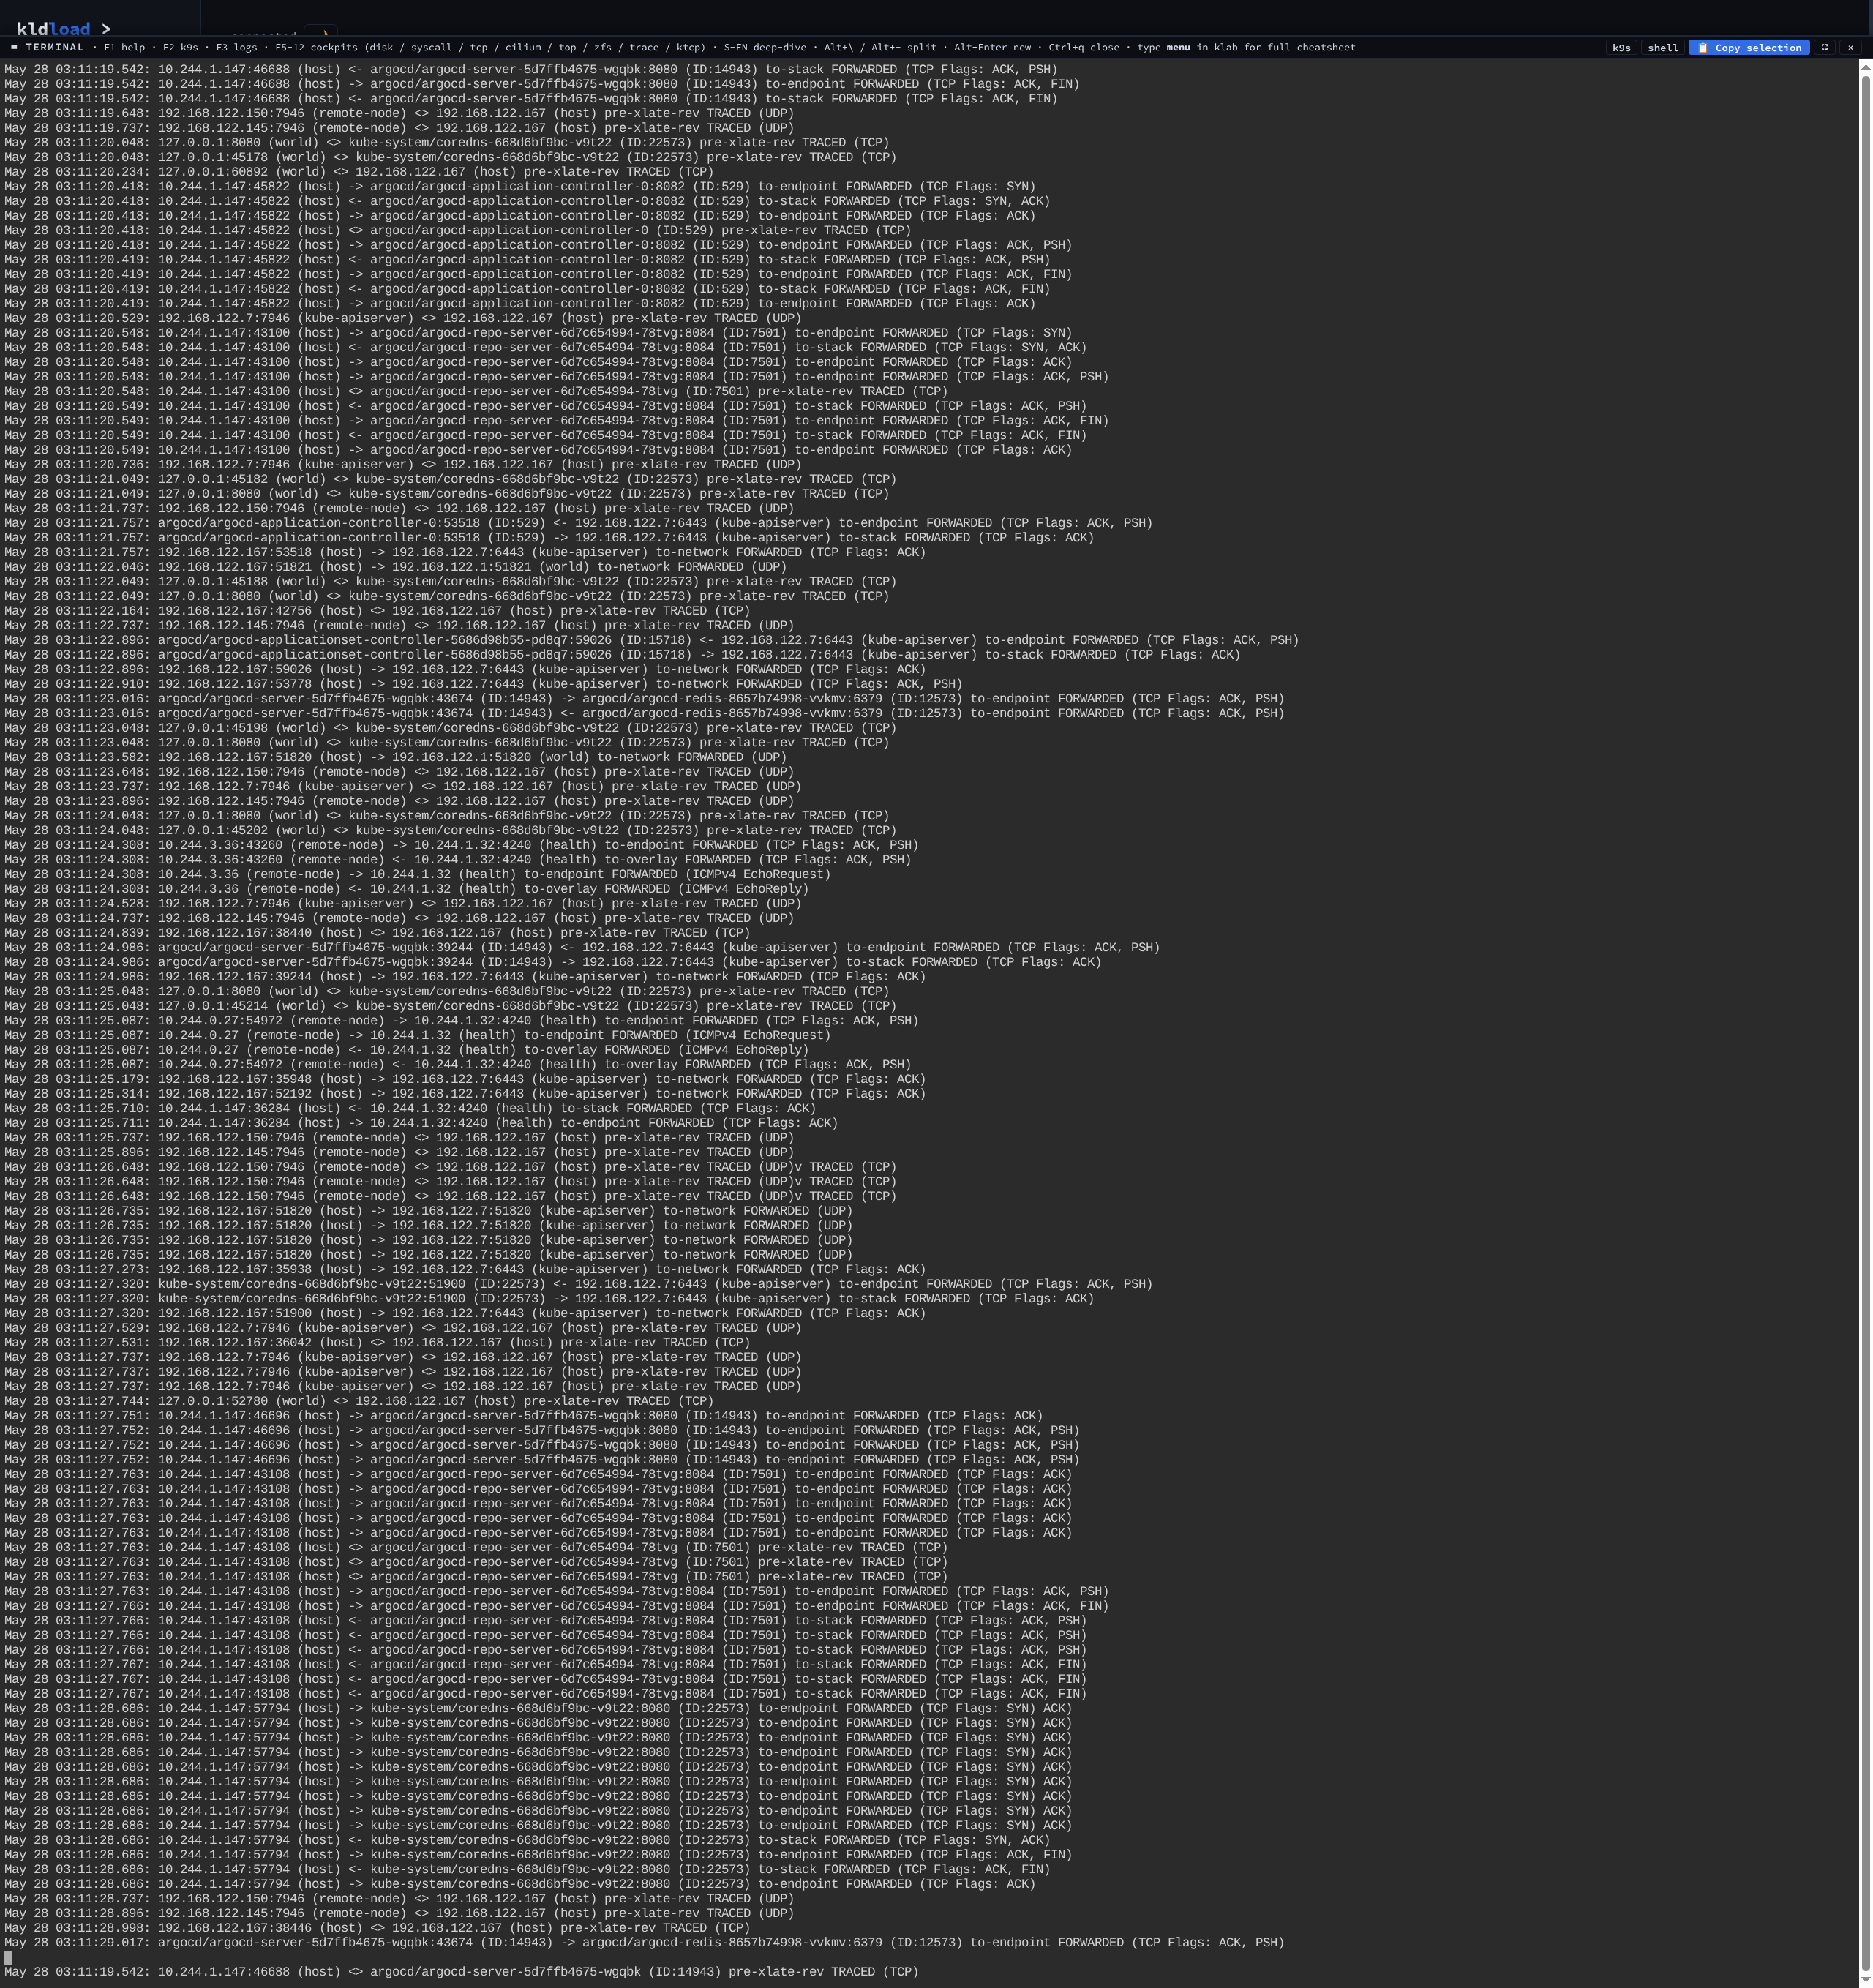
F-keys not pictured but shipped: F3 unified log tail, F4 webui journal, F5 disk bcc cockpit (biosnoop + biolatency + fileslower + zfsdist), F7 TCP bcc cockpit (tcpconnect + tcpretrans + tcplife), F8 Cilium state, F9 htop, F10 ZFS group, F11 tracing (Hubble + Tetragon + kernel log), F12 kernel-stress cockpit (PSI + runqlat + softirqs + hardirqs + bpf-prog), plus the Shift overlays. Press the key; the cockpit opens. Press it again; it closes.
ZFS & Snapshots
To ZFS, it’s all just a dataset. A VM disk, a Postgres tablespace, a Kubernetes persistent volume, a container layer, a 14 GB OS image — same shape underneath. The platform is built around that from day zero: no separate volume manager, no CSI sidecar, no “storage tier” to model in your head. Running it isn’t the hard part. The hard part is realizing how many of the problems you used to fight — backups, snapshots, clones, rollbacks — stop existing the moment you stop bolting them on as their own machinery.
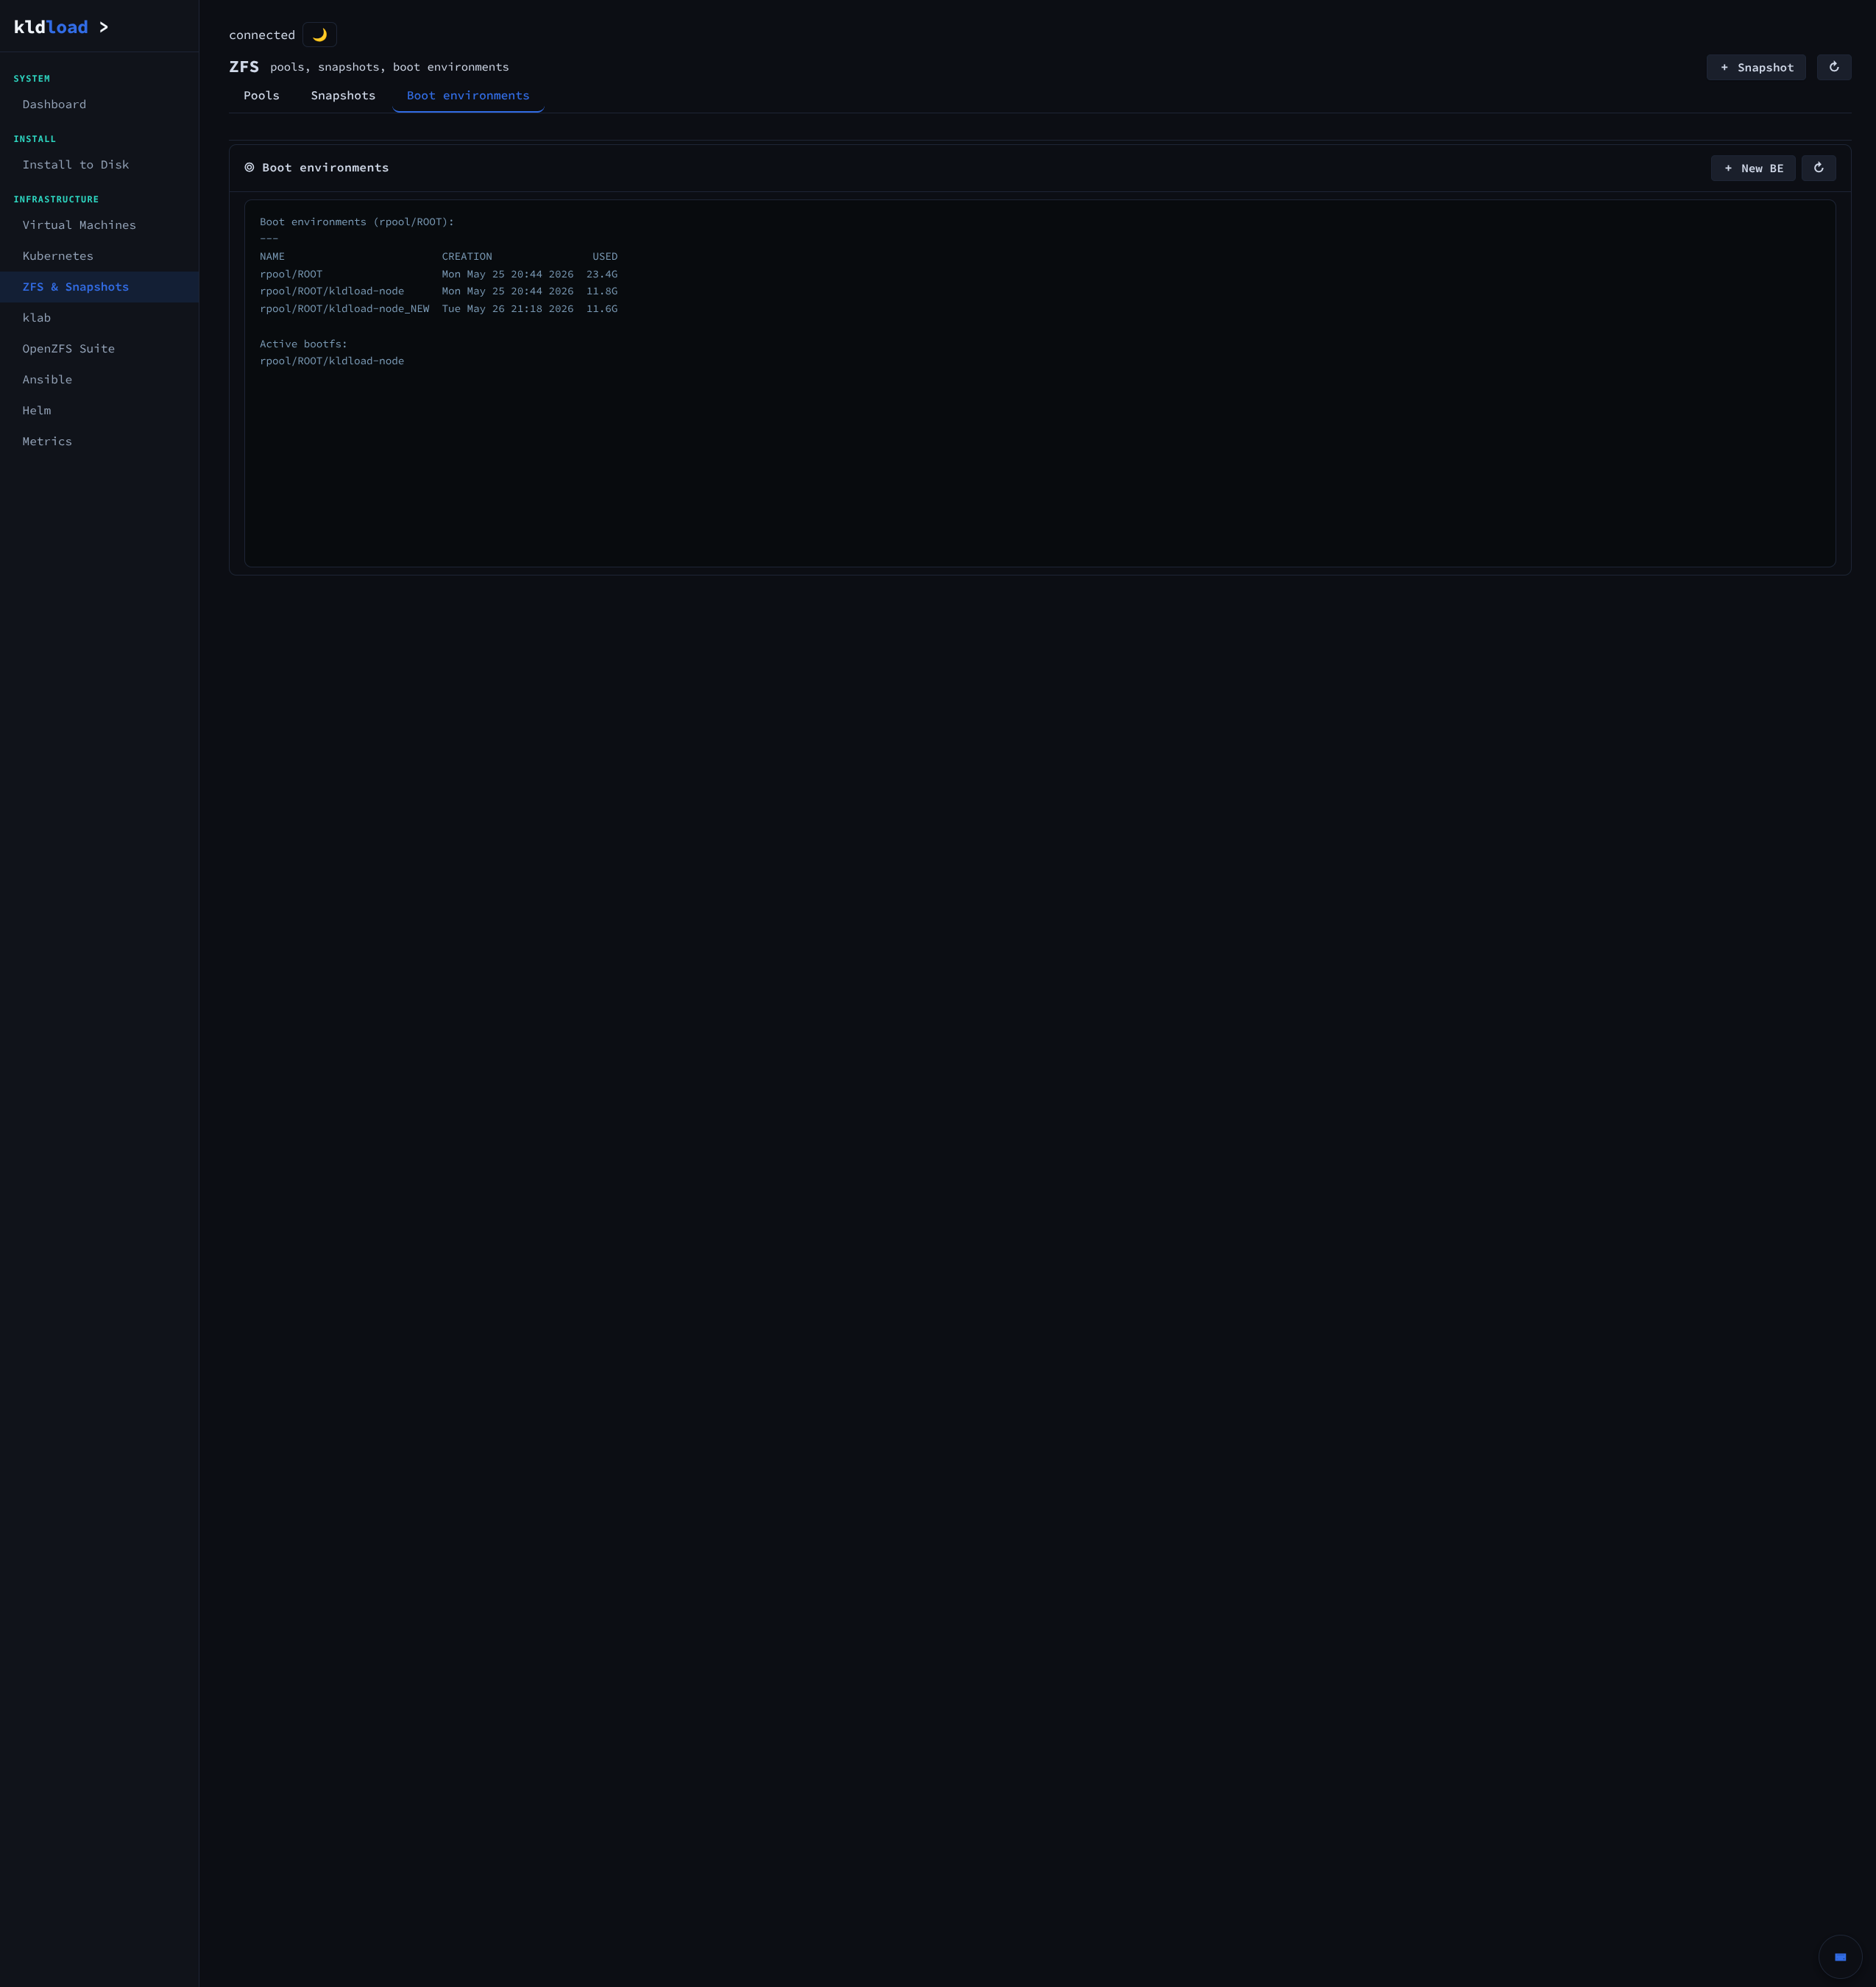
Boot Environments
“These aren’t the kernels you’re looking for.” A routine kernel update lands, the matching ZFS module isn’t there (DKMS quietly failed, or upstream OpenZFS hasn’t caught up to the new kernel yet), and on the next reboot the pool refuses to import. Your data is fine — you just can’t see it. Here, kpkg refuses the upgrade outright if it would leave you without a working ZFS module, and ZFSBootMenu keeps the previous boot environment one keypress away. Worst case — bad upgrade slipped through — you reboot, pick the older entry, log in. About ninety seconds. Zero data risk.
Pools and Snapshots tabs are also part of this section; their dashboards live under the Metrics section below where they get the visual weight they deserve.
klab — multi-distro test platform
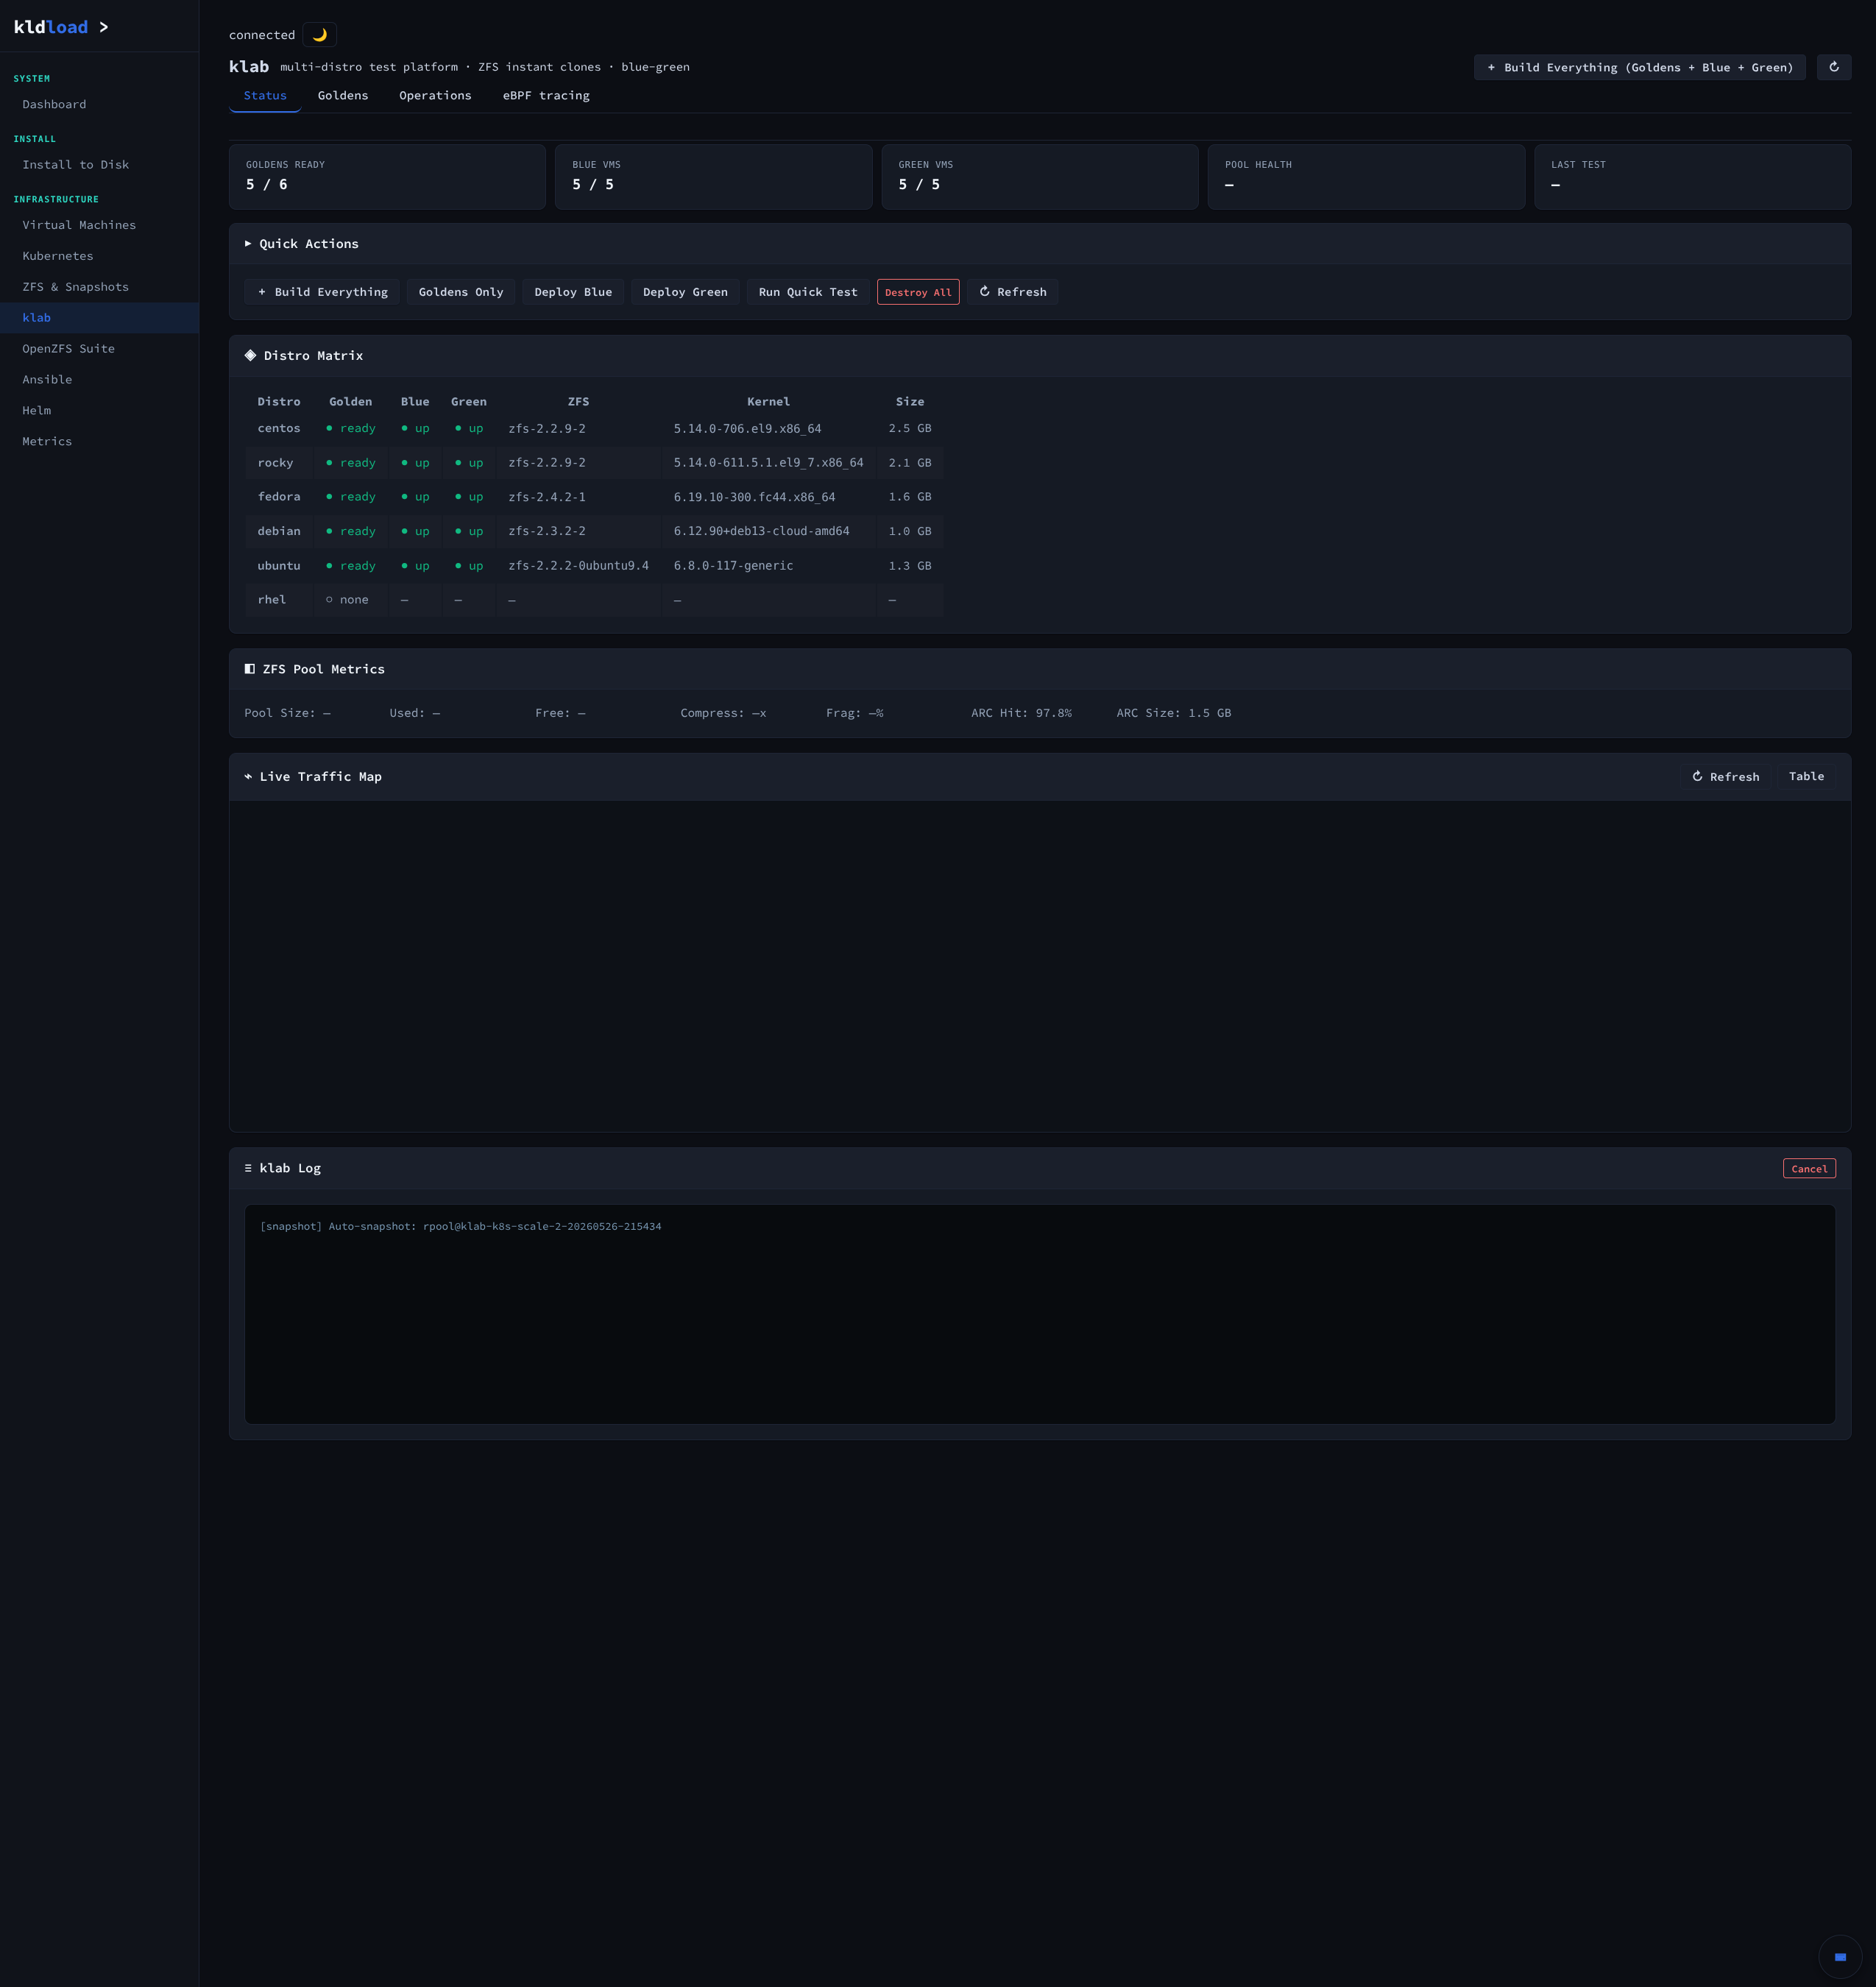
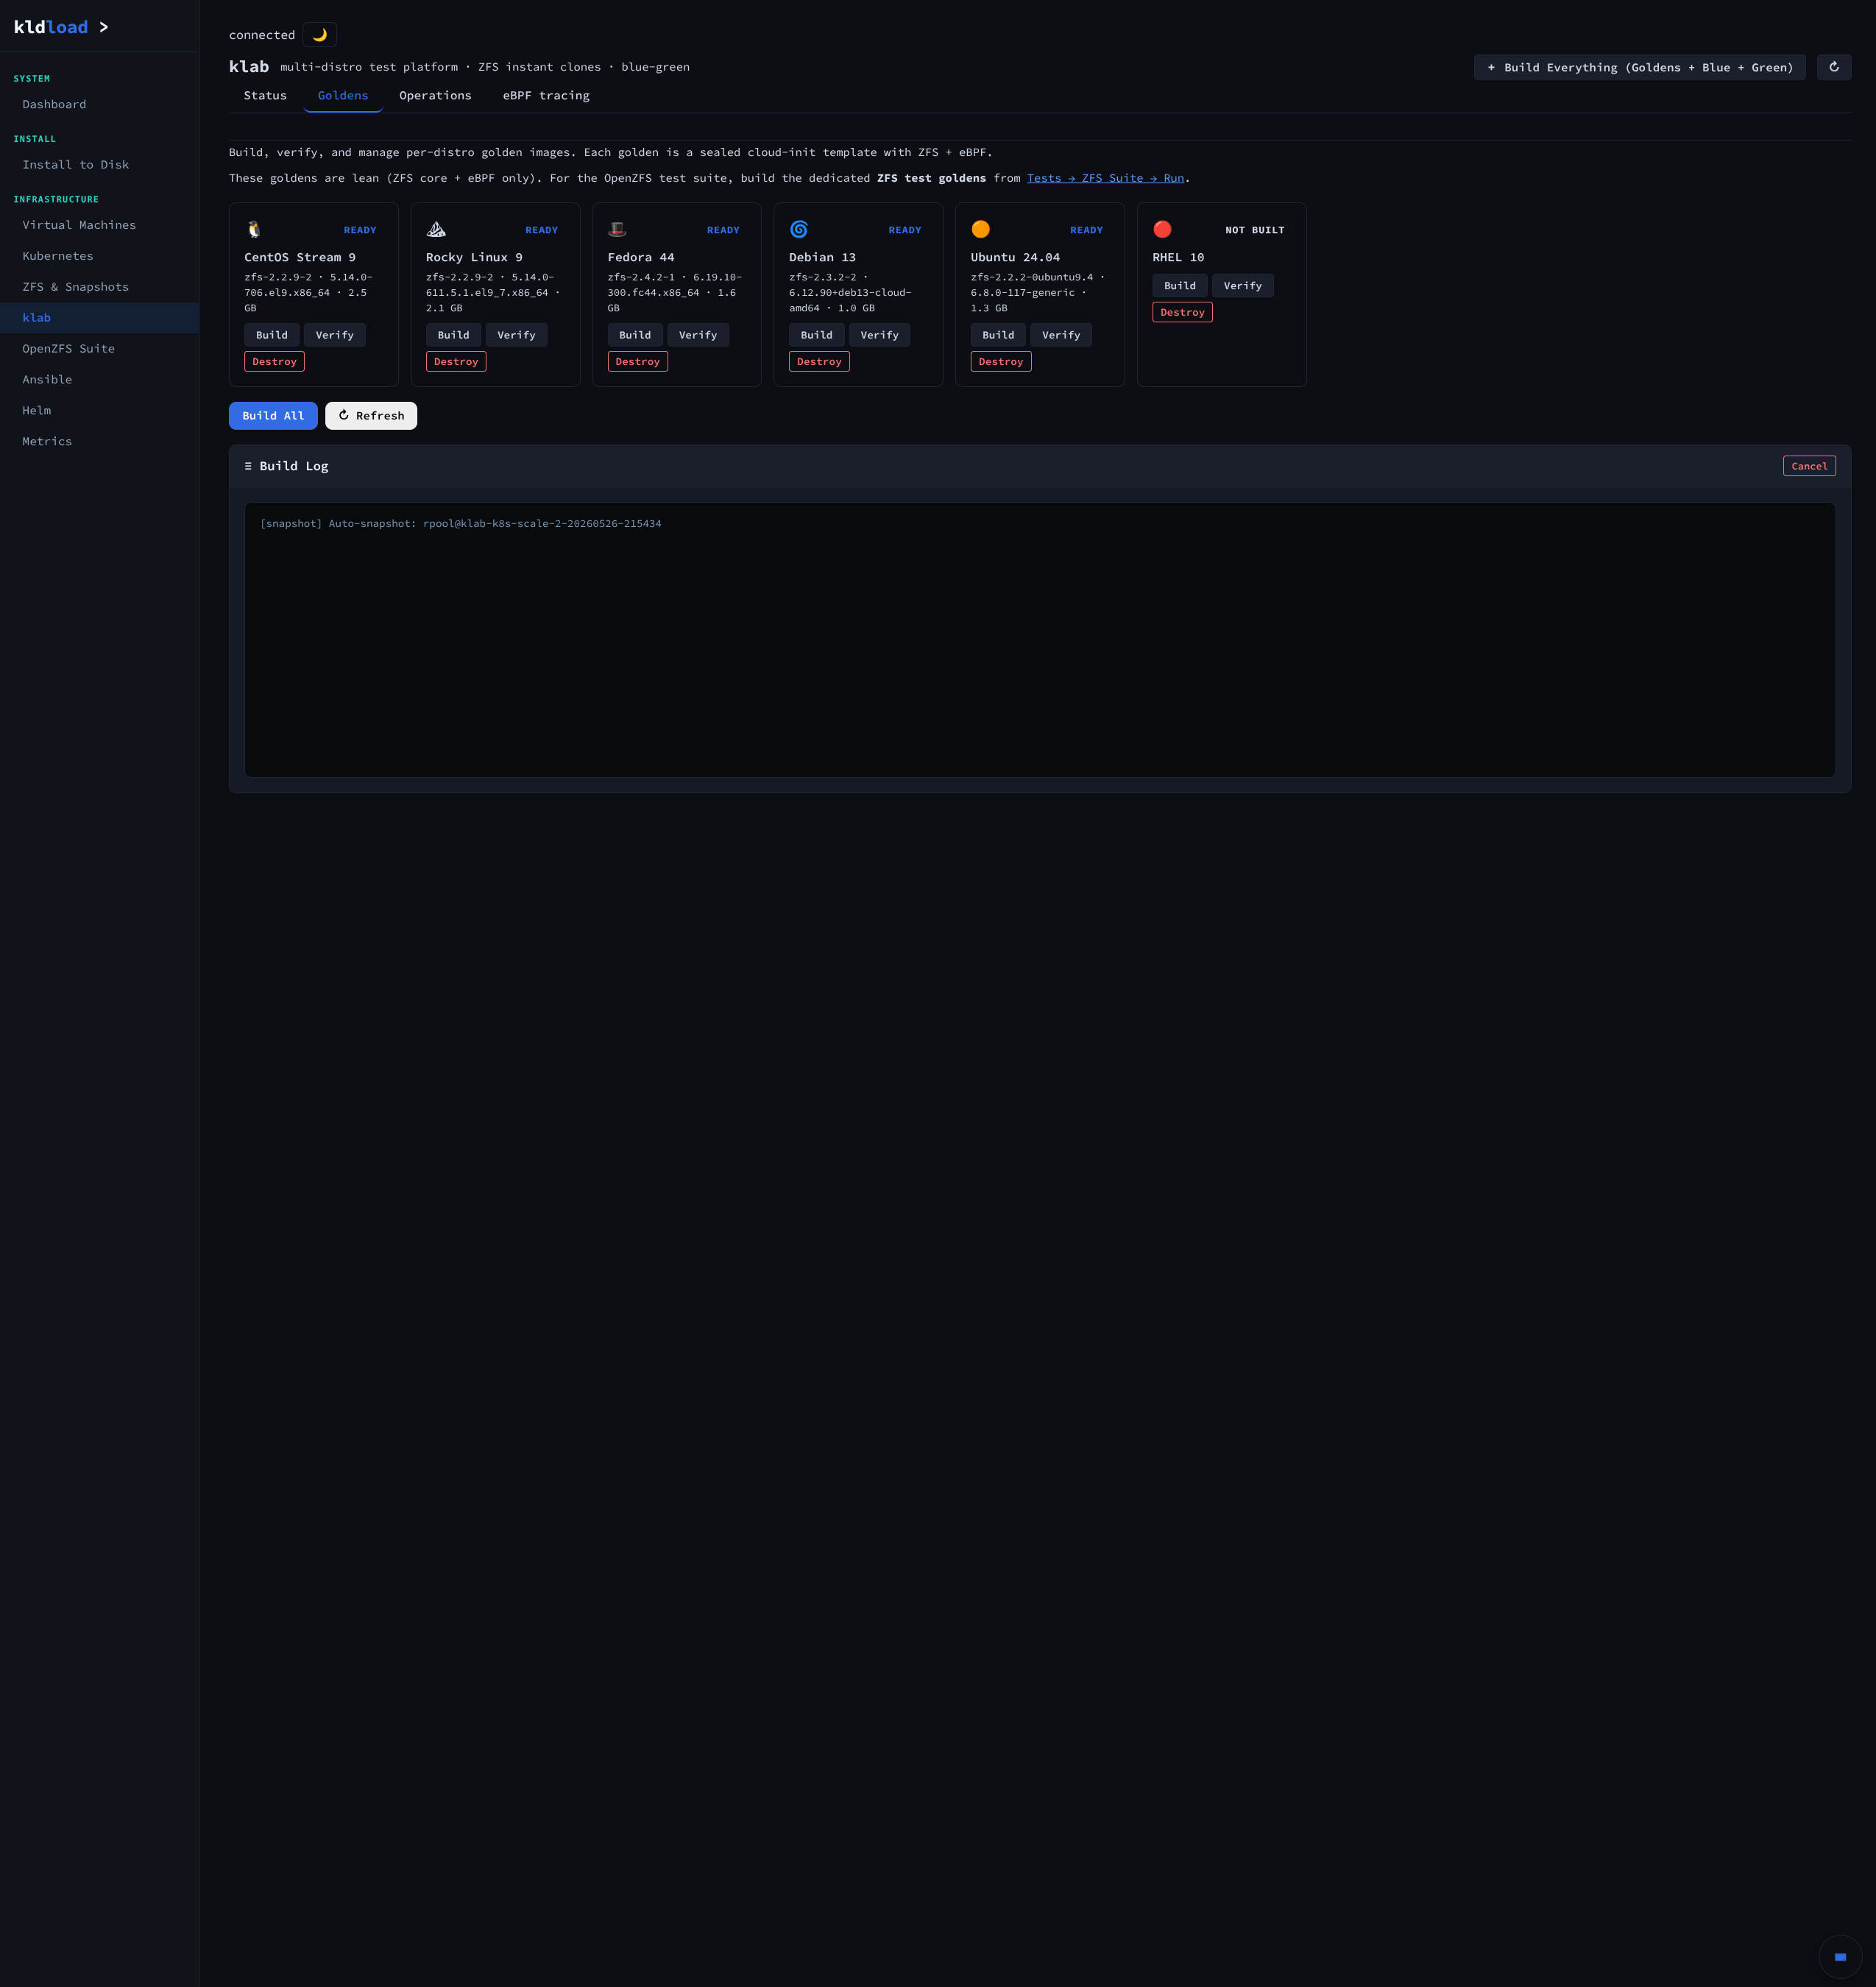
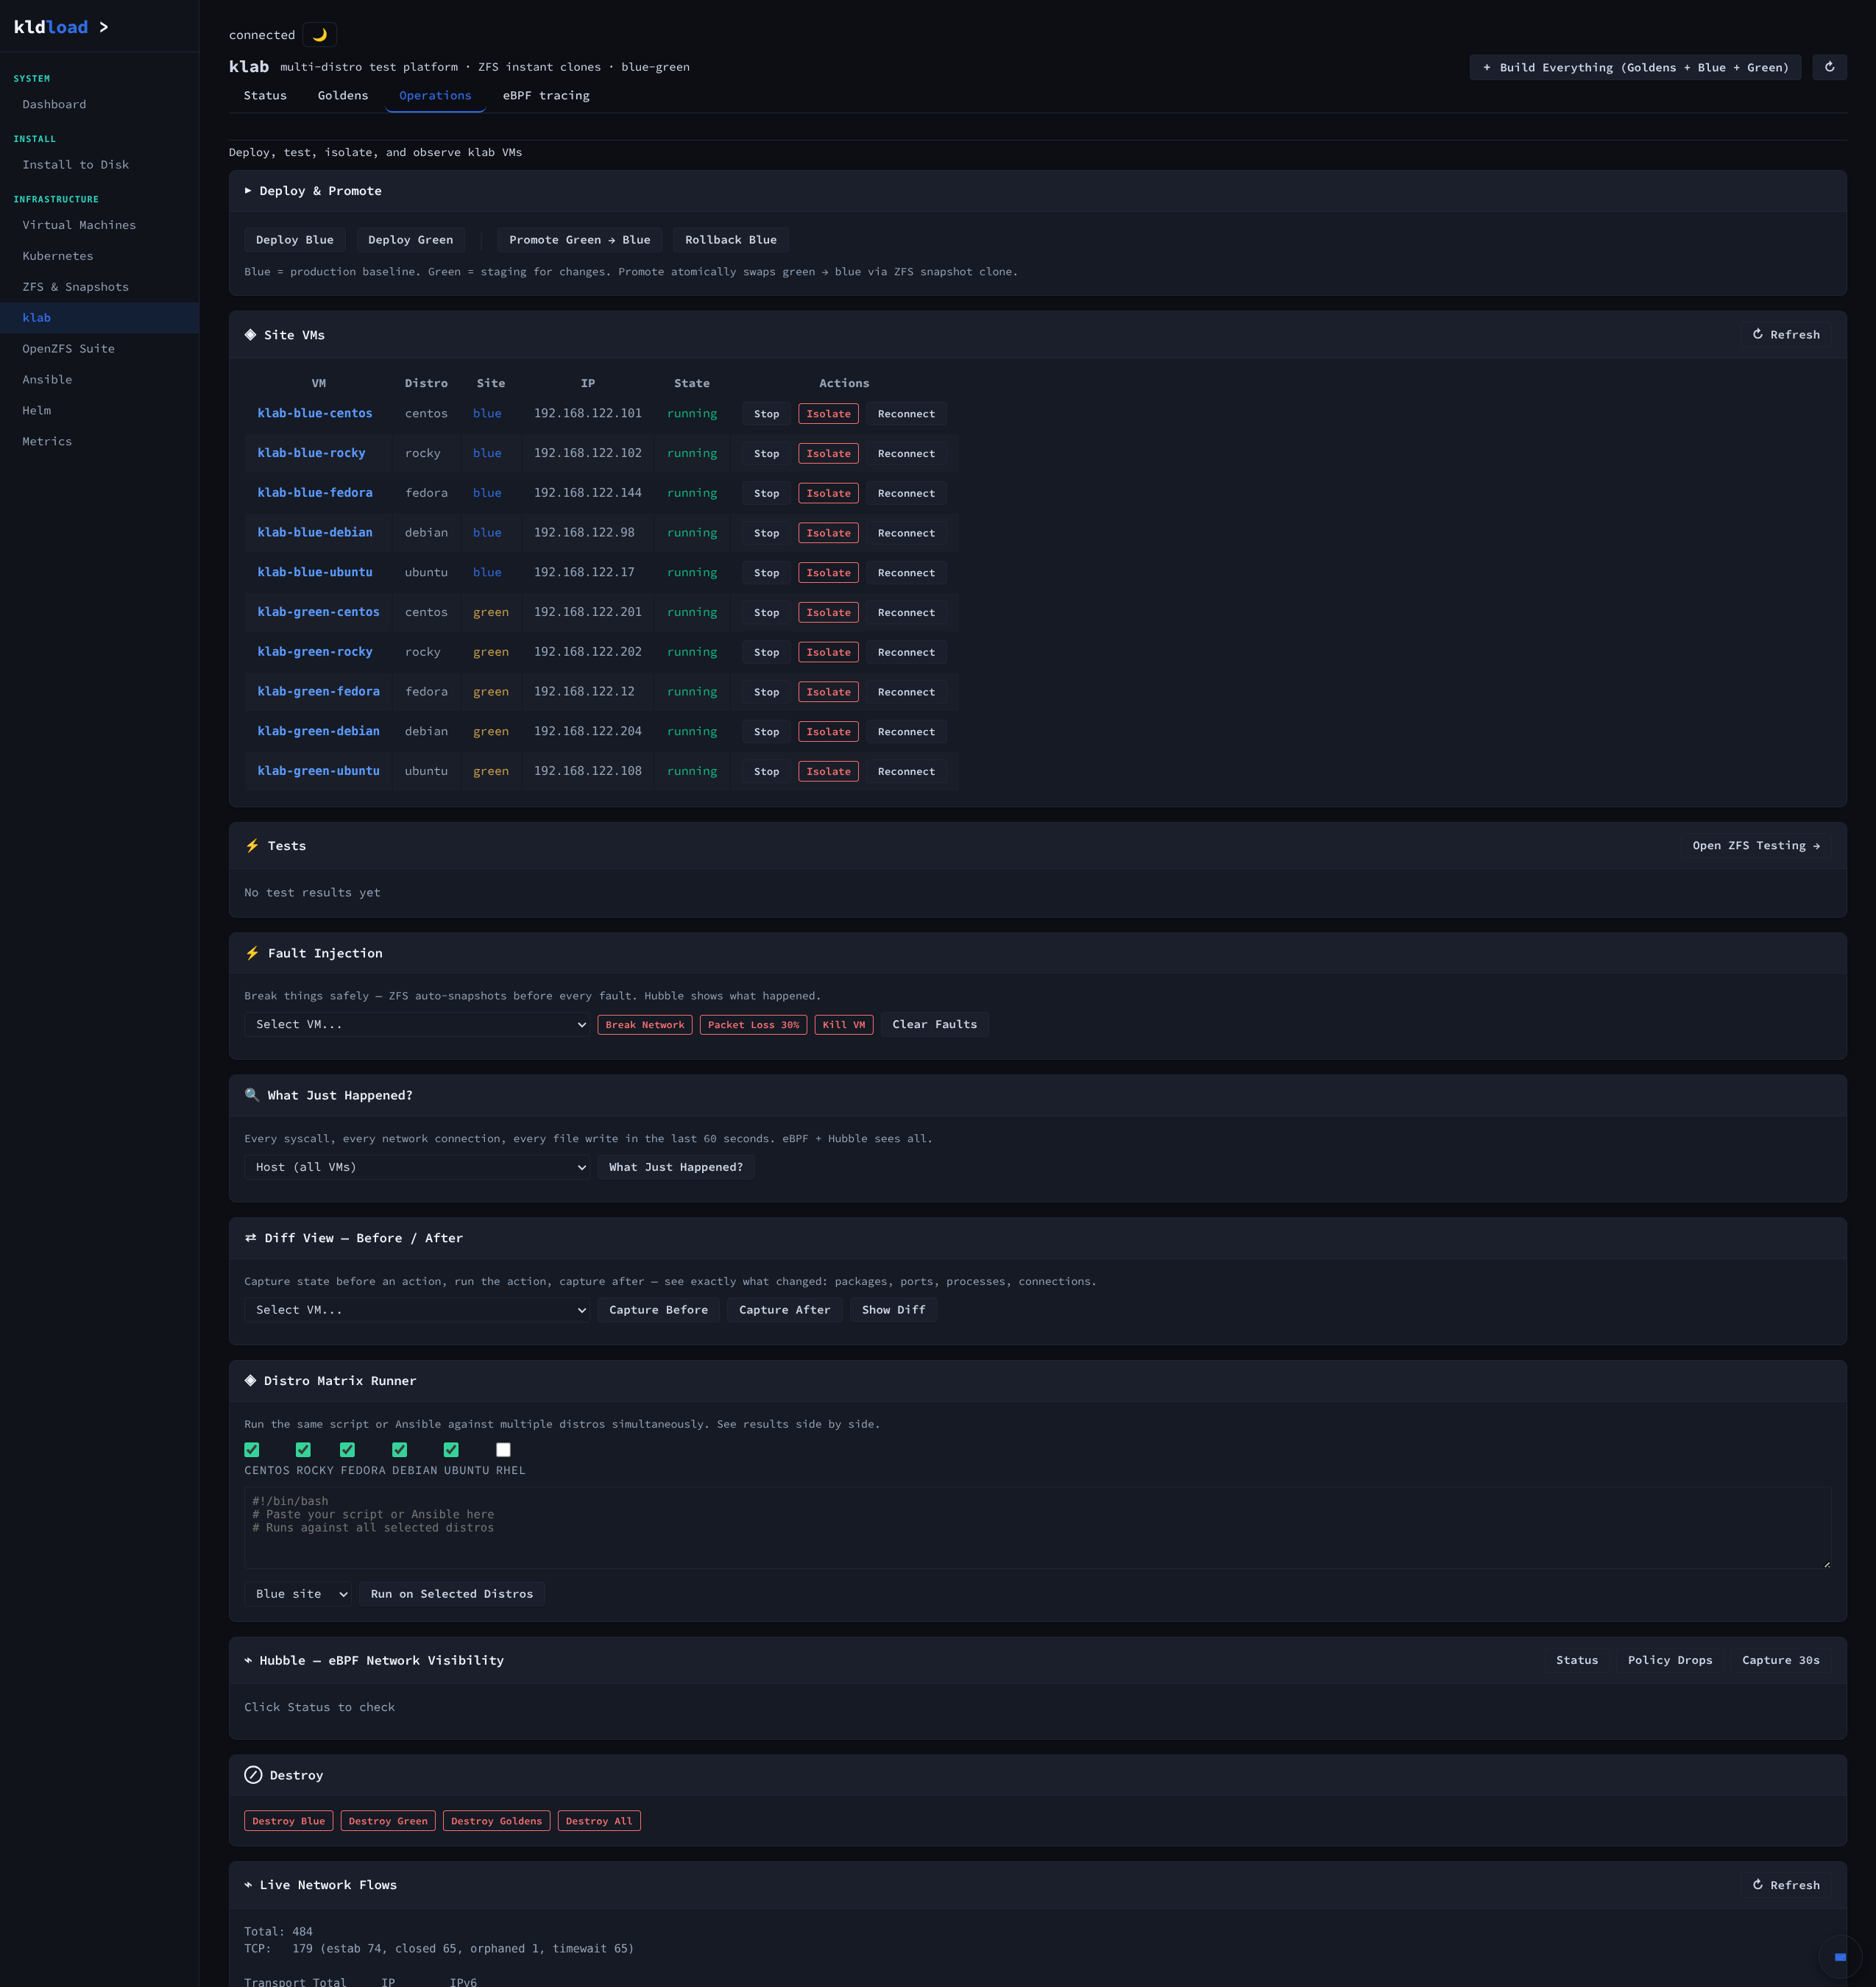
Point-and-shoot VM blue/green. Every team in the industry built a roadmap around this and then quietly dropped it — parallel VM fleets, custom state sync, scripted cutover, restore-from-backup as the rollback plan — and settled for container-only blue/green as the practical compromise. Here every VM is a ZFS clone of its golden, so spinning up the green stack alongside blue takes milliseconds and costs no storage until the two start to diverge. Promote, rollback, or destroy is one click each.
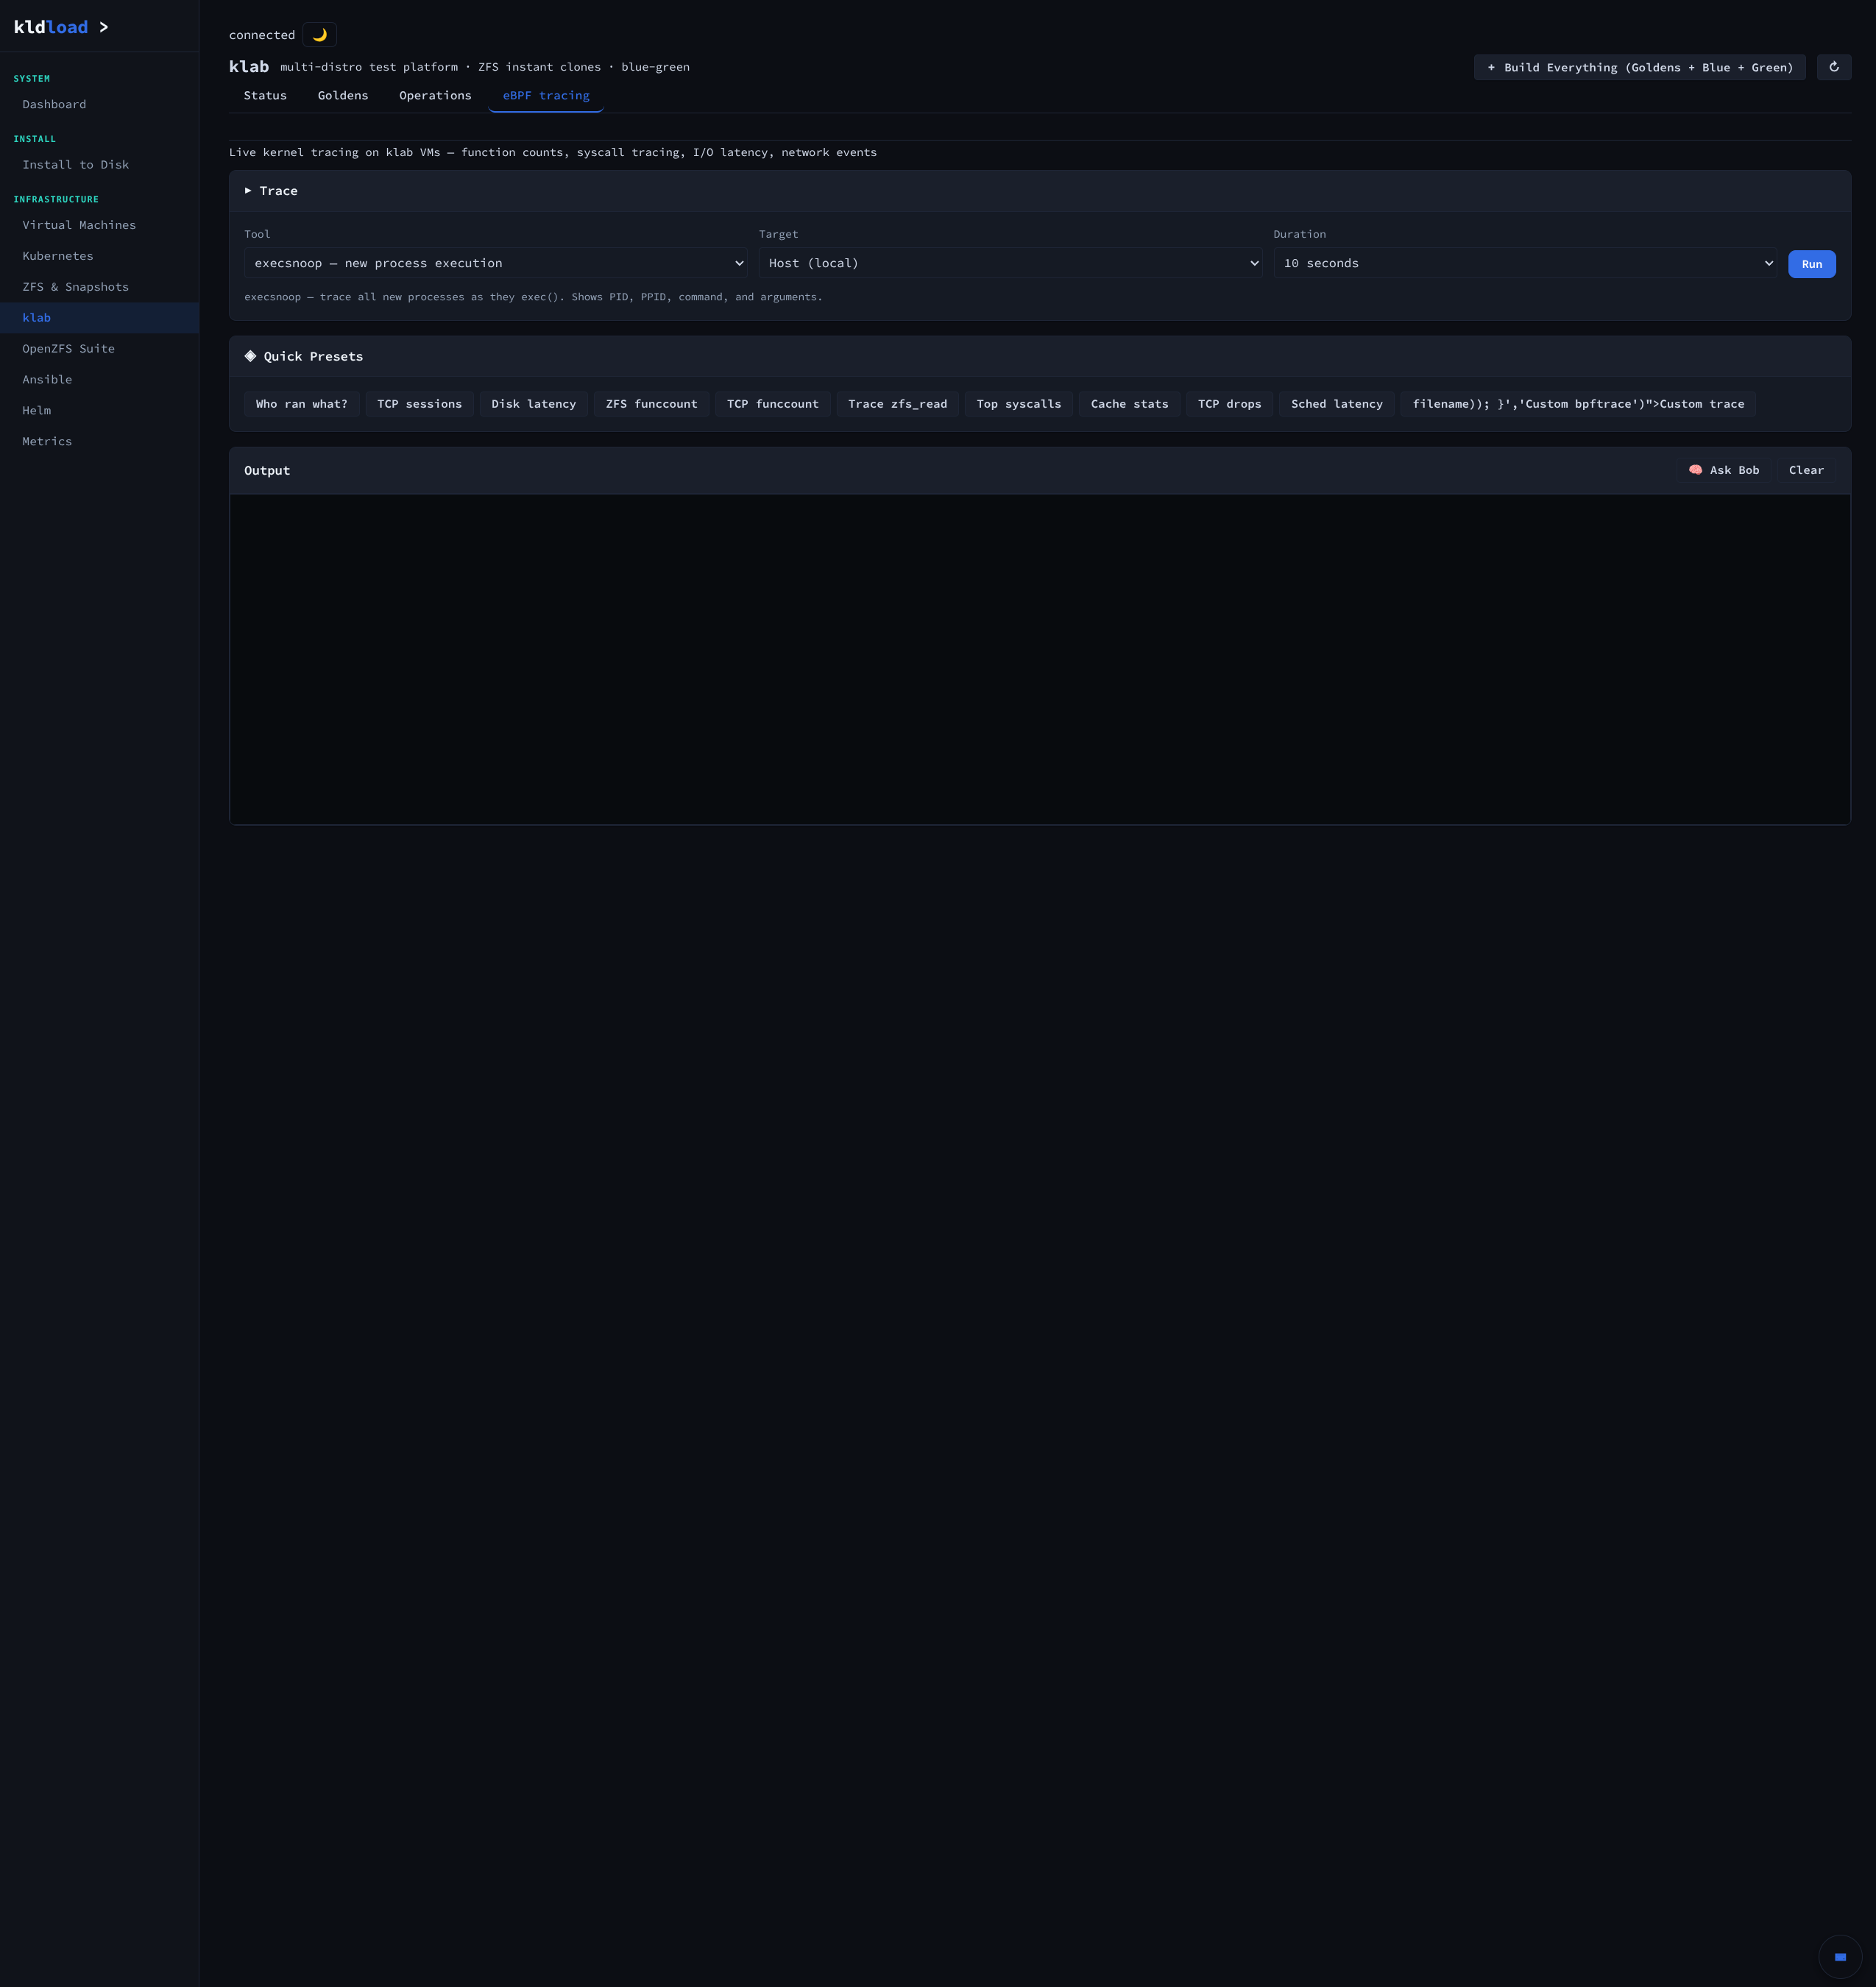
The screenshots show the matrix mapped to five distros — that’s the example. The same ten slots could be dev / qa / uat / stage / prod-mirror, or kernel-6.18 / 6.19 / 6.20, or one slot per customer tenant. Cross-distro testing is the canonical demo; the underlying primitive is N parameterized cloned environments observable side by side.
Status, Goldens, Operations, eBPF tracing
Status (5 distros up blue + green, kernel and ZFS version per row), Goldens (per-distro template cards, instant clone from snapshot), Operations (deploy / promote / rollback + fault injection + the eBPF “what just happened” surface), eBPF tracing (presets for execsnoop, TCP, ZFS function counts, custom bpftrace).
OpenZFS Suite — the test host
This is what kldload is at the deepest layer: a host purpose-built to run the upstream OpenZFS zfs-tests.sh at scale, across every distro, on every kernel + ZFS combo, without spending a week first standing up the rig. ZFS configured correctly at install, per-distro goldens cloned in milliseconds, boot environments to recover from a bad combo, observability watching the run from the moment of boot, a 5-distro matrix in parallel. The audience that gains the most from this isn’t homelab hobbyists — it’s upstream OpenZFS developers, distro kernel maintainers, and ZoL contributors who lose days to test-rig setup every time a new kernel lands.
The launch — the first sixty seconds of a real test run
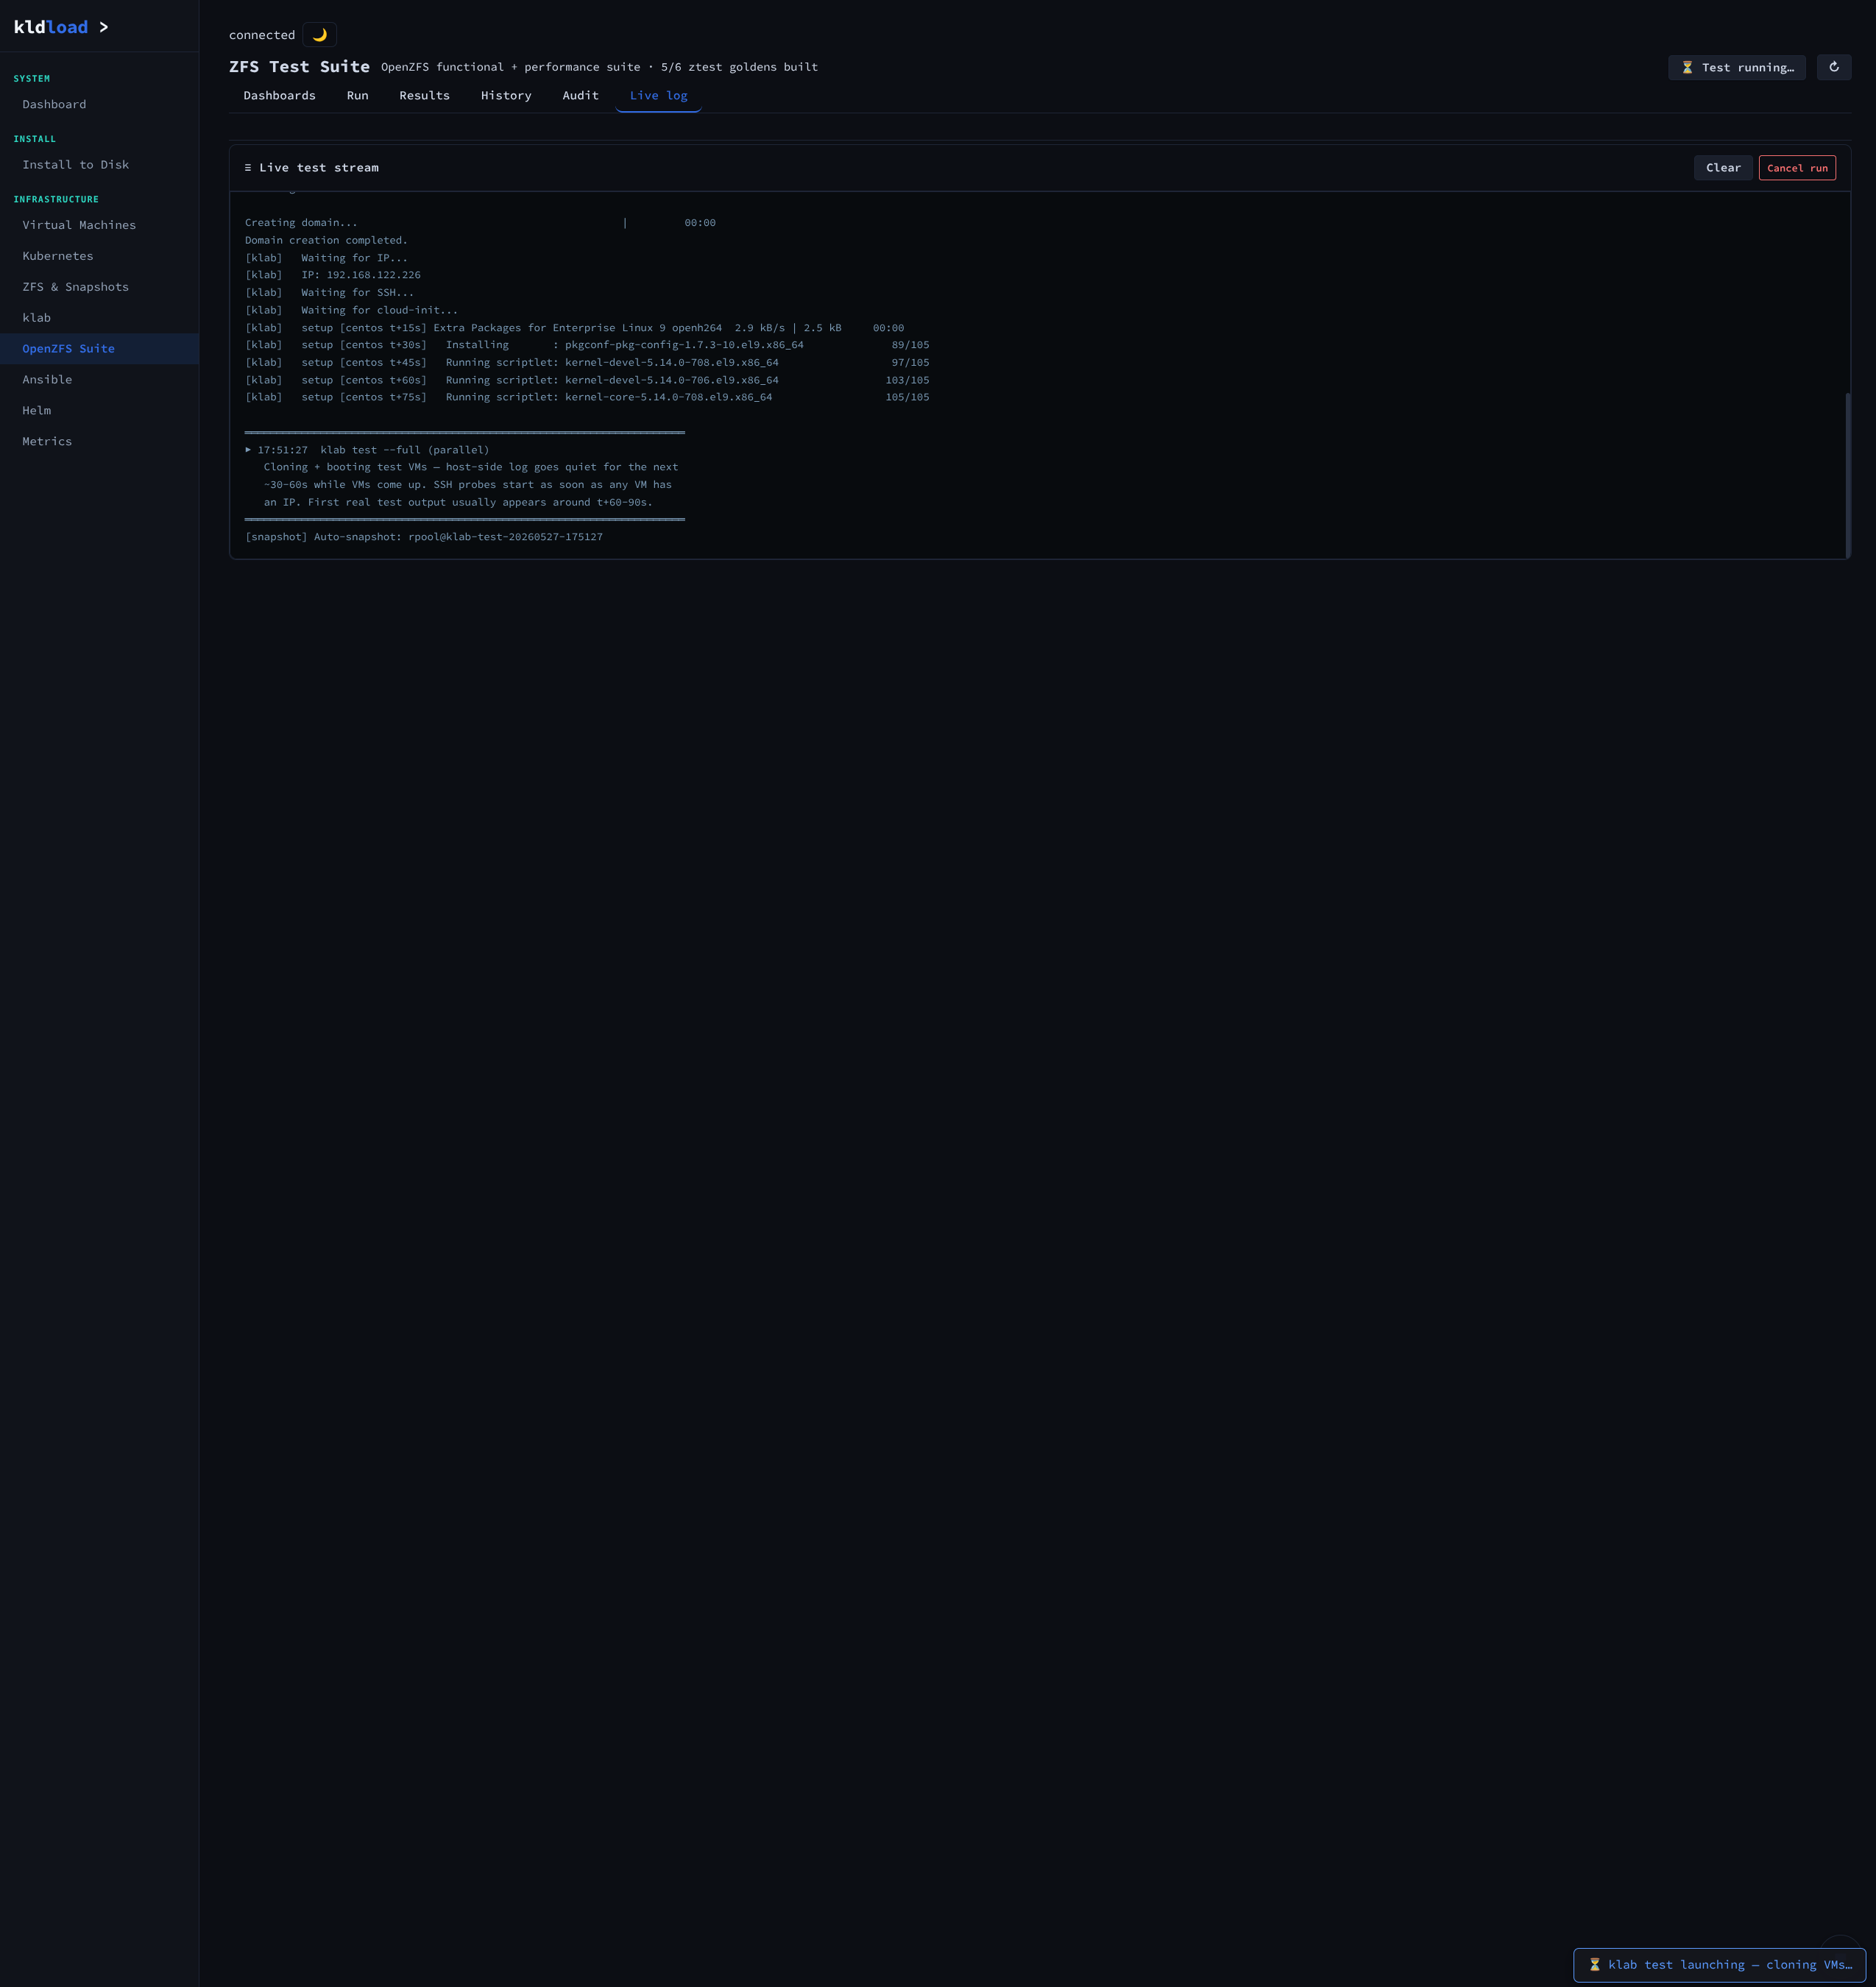
The user clicks Run Quick Test on the “Run” tab. The host log narrates the early phase: klab test --full (parallel) fires, cloud-init iso created, libvirt domain created, IP arrives at 192.168.122.226, cloud-init finishes, package install runs (kernel-devel, pkgconf-pkg-config, scriptlets), then a brief hush while four more VMs catch up. The inline note explains the hush instead of leaving the user wondering: “Cloning + booting test VMs — host-side log goes quiet for the next 30-60s while VMs come up. SSH probes start as soon as any VM has an IP. First real test output usually appears around t+60-90s.” You don’t lose the user during the cold-start because the system tells you it’s coming.
The test live — while it’s running
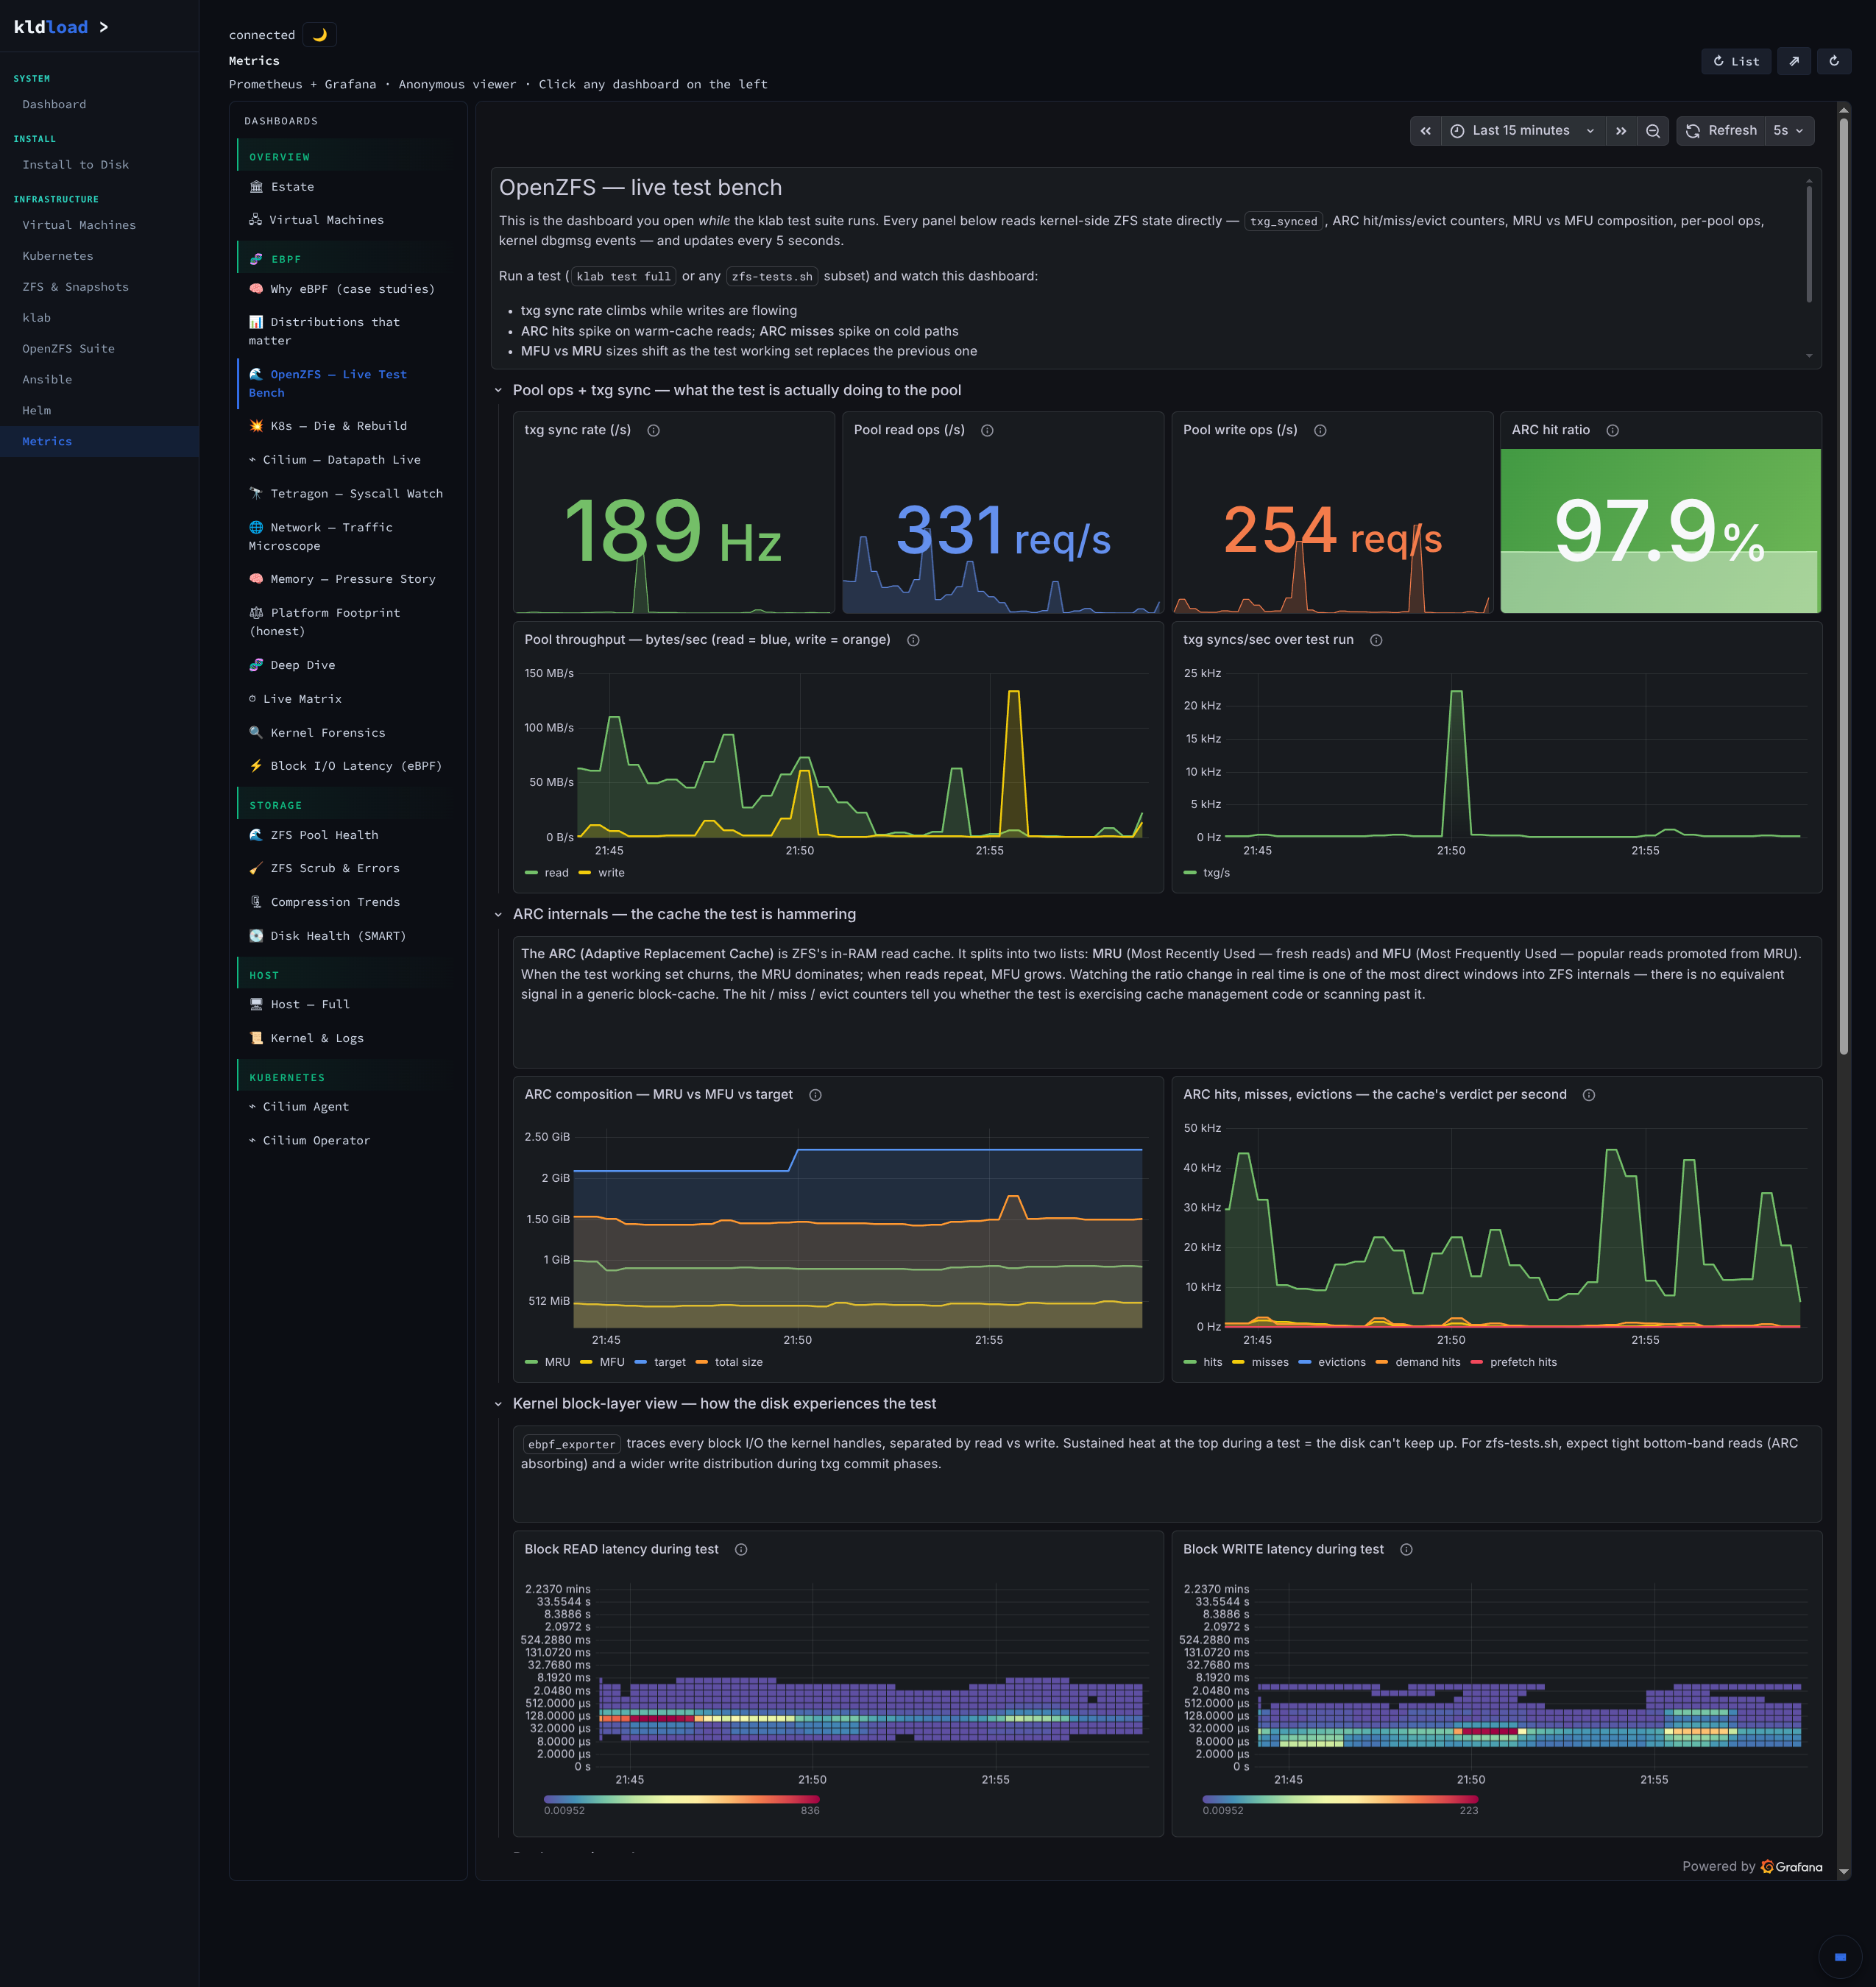
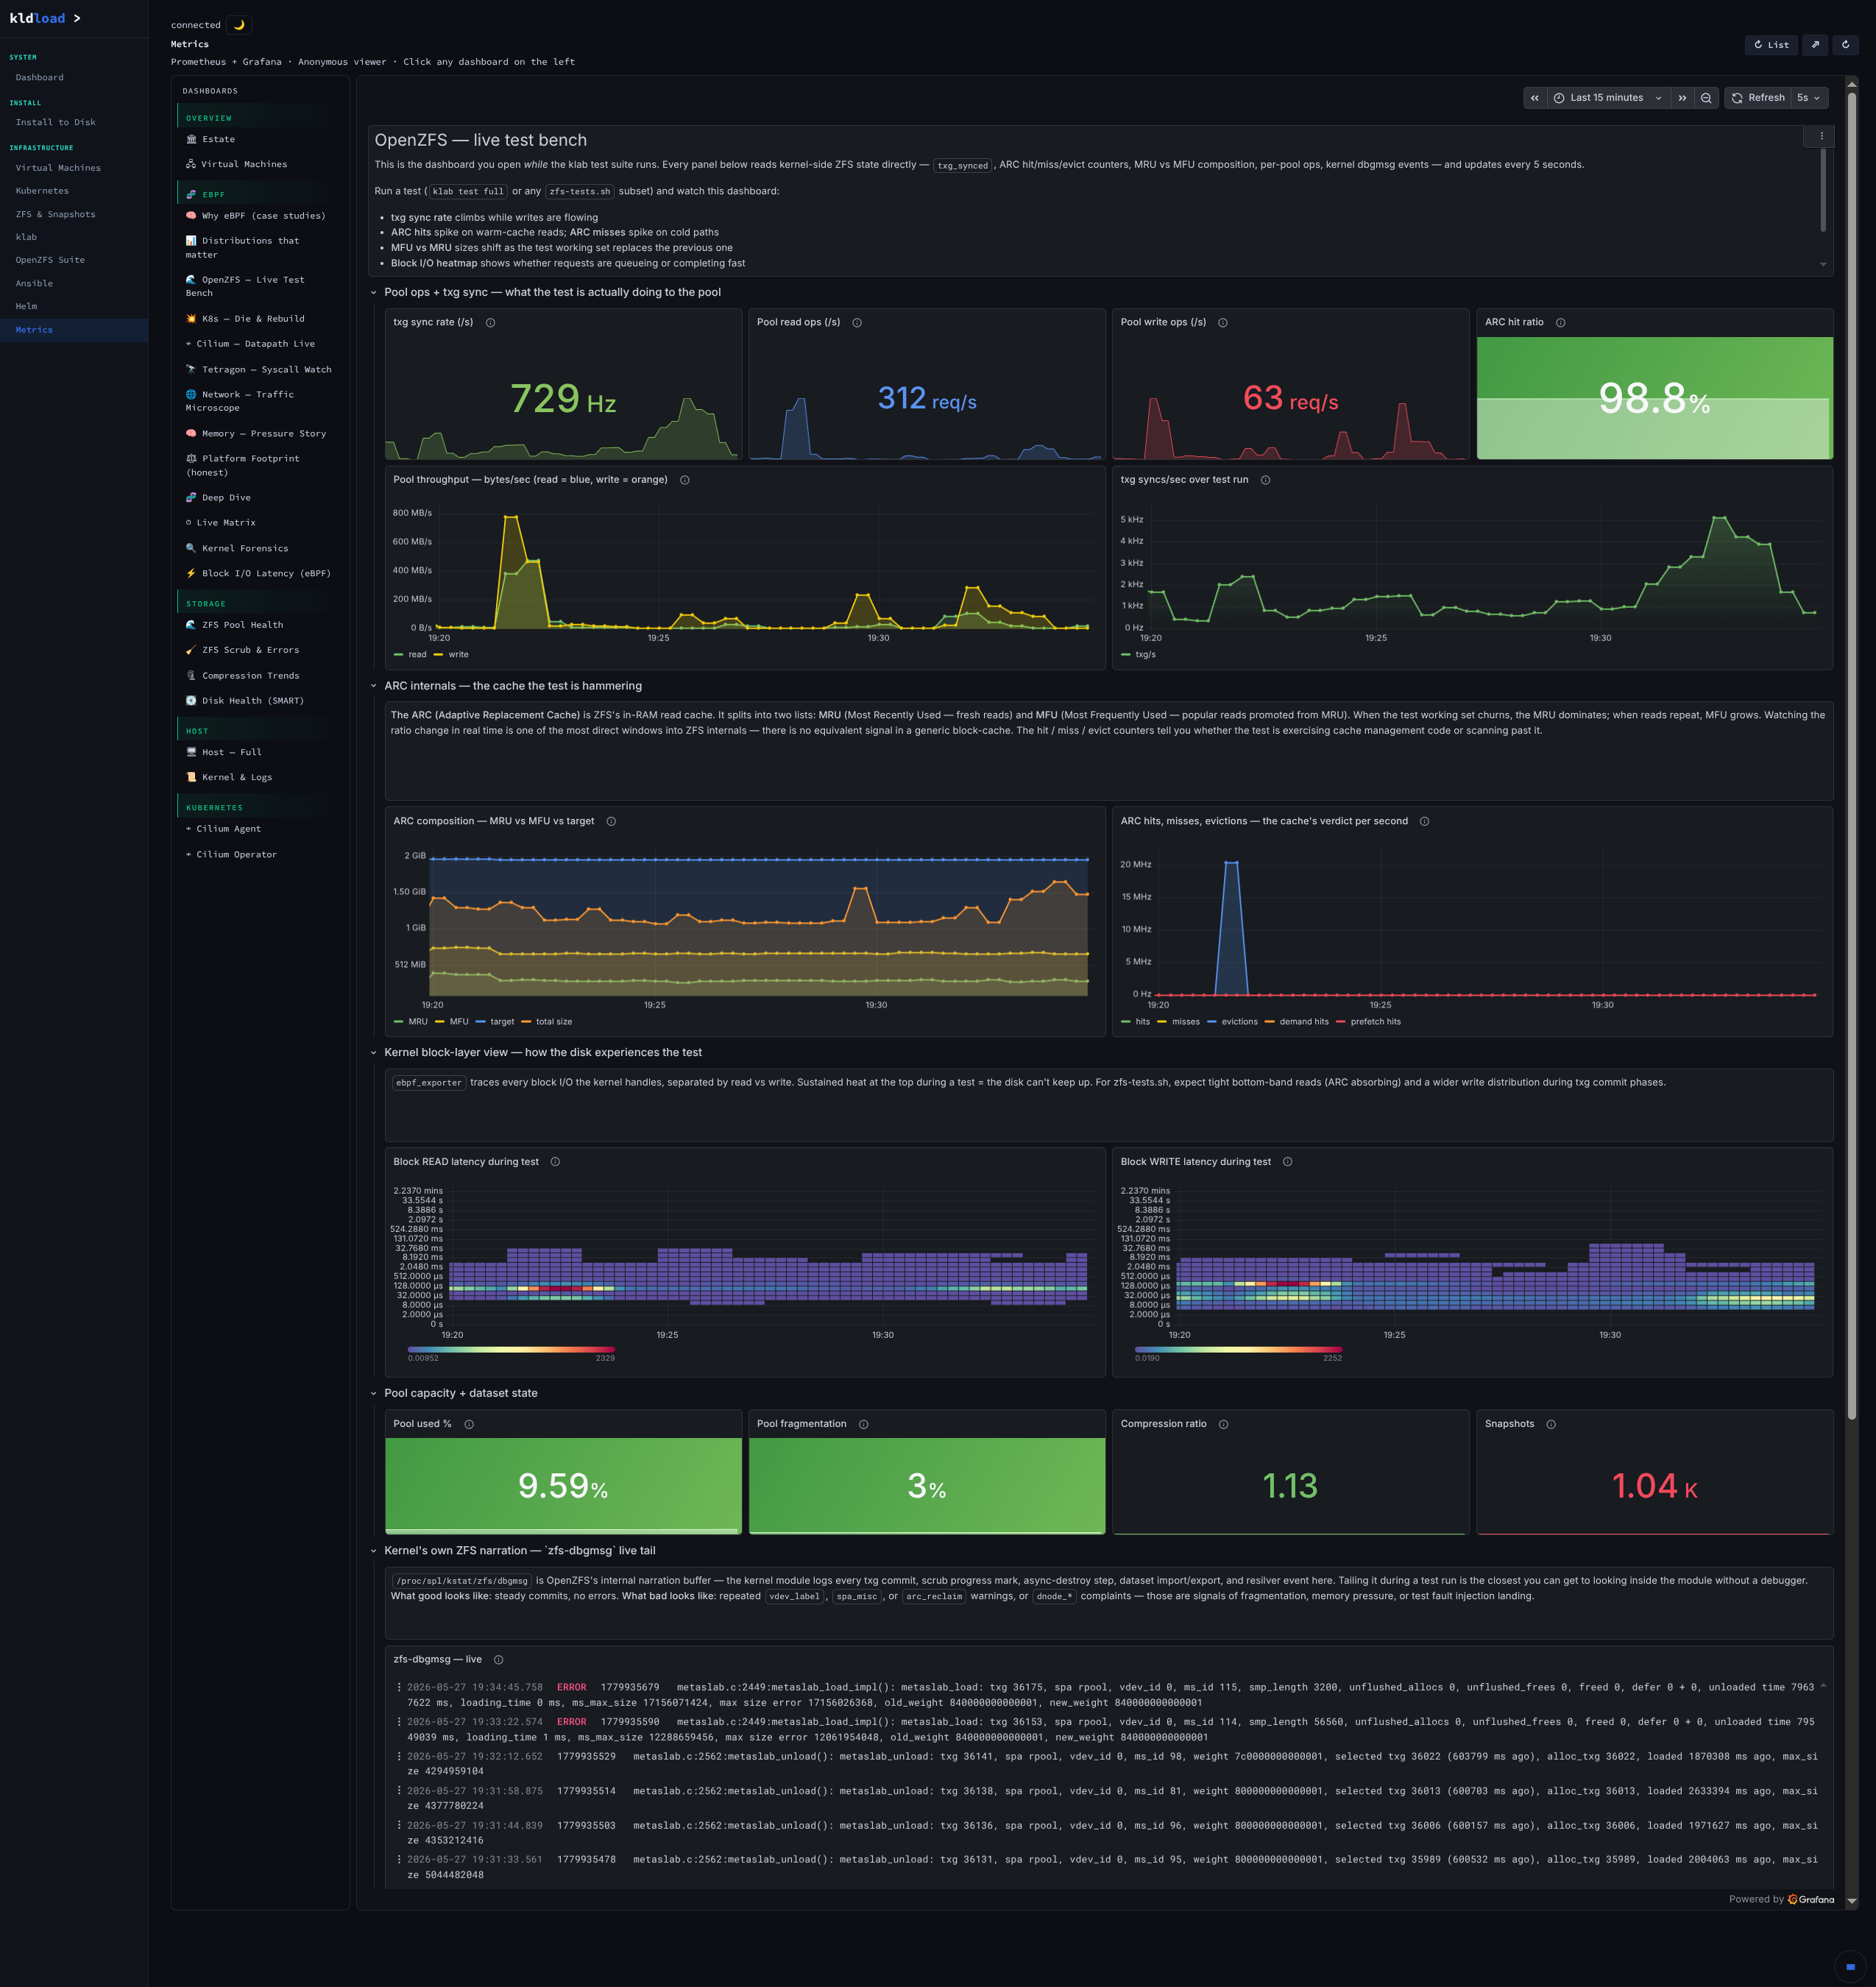
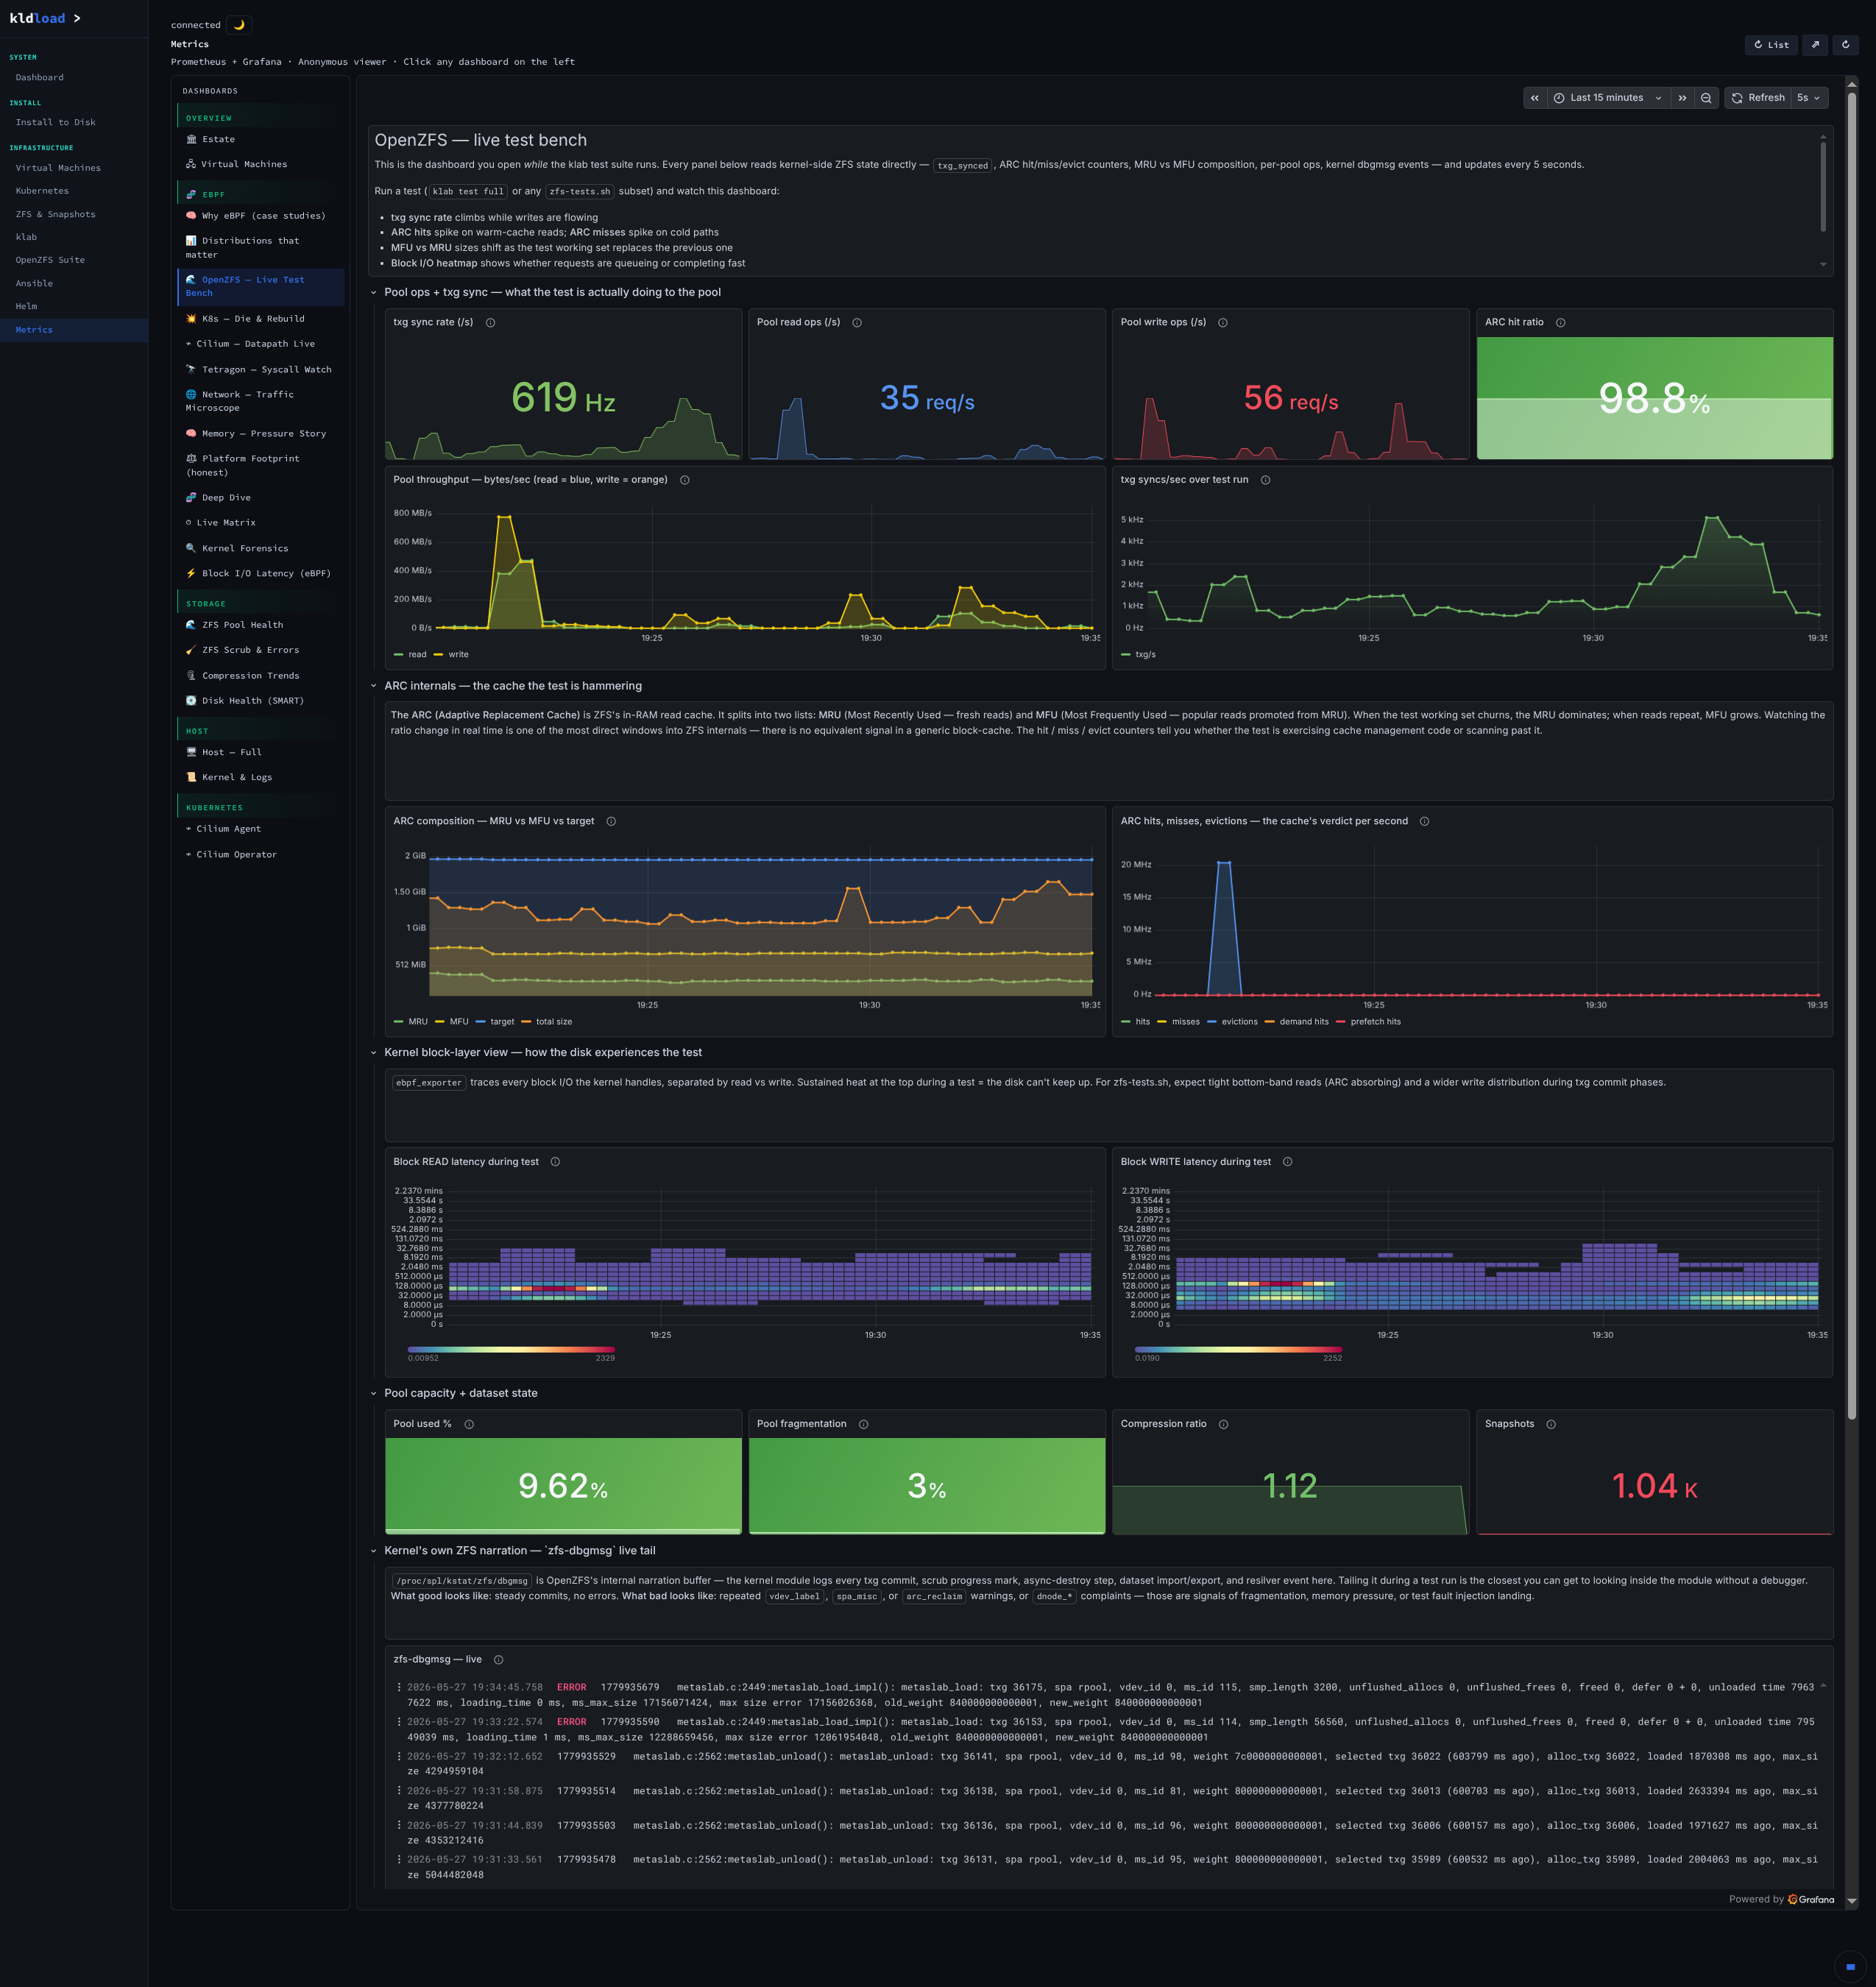
The top of the suite’s “Dashboards” view shows the test workload narrating itself in real time: ops/sec on the pool, ARC behavior, txg sync rate, latency histograms from ebpf_exporter, the kernel’s own zfs-dbgmsg stream at the bottom. Two captures, seconds apart — same view, different instant in the run, the numbers visibly moving. This is what live narration of zfs-tests.sh looks like when the observability stack booted with the box.
Results — PASS / FAIL / SKIP across every distro, every test
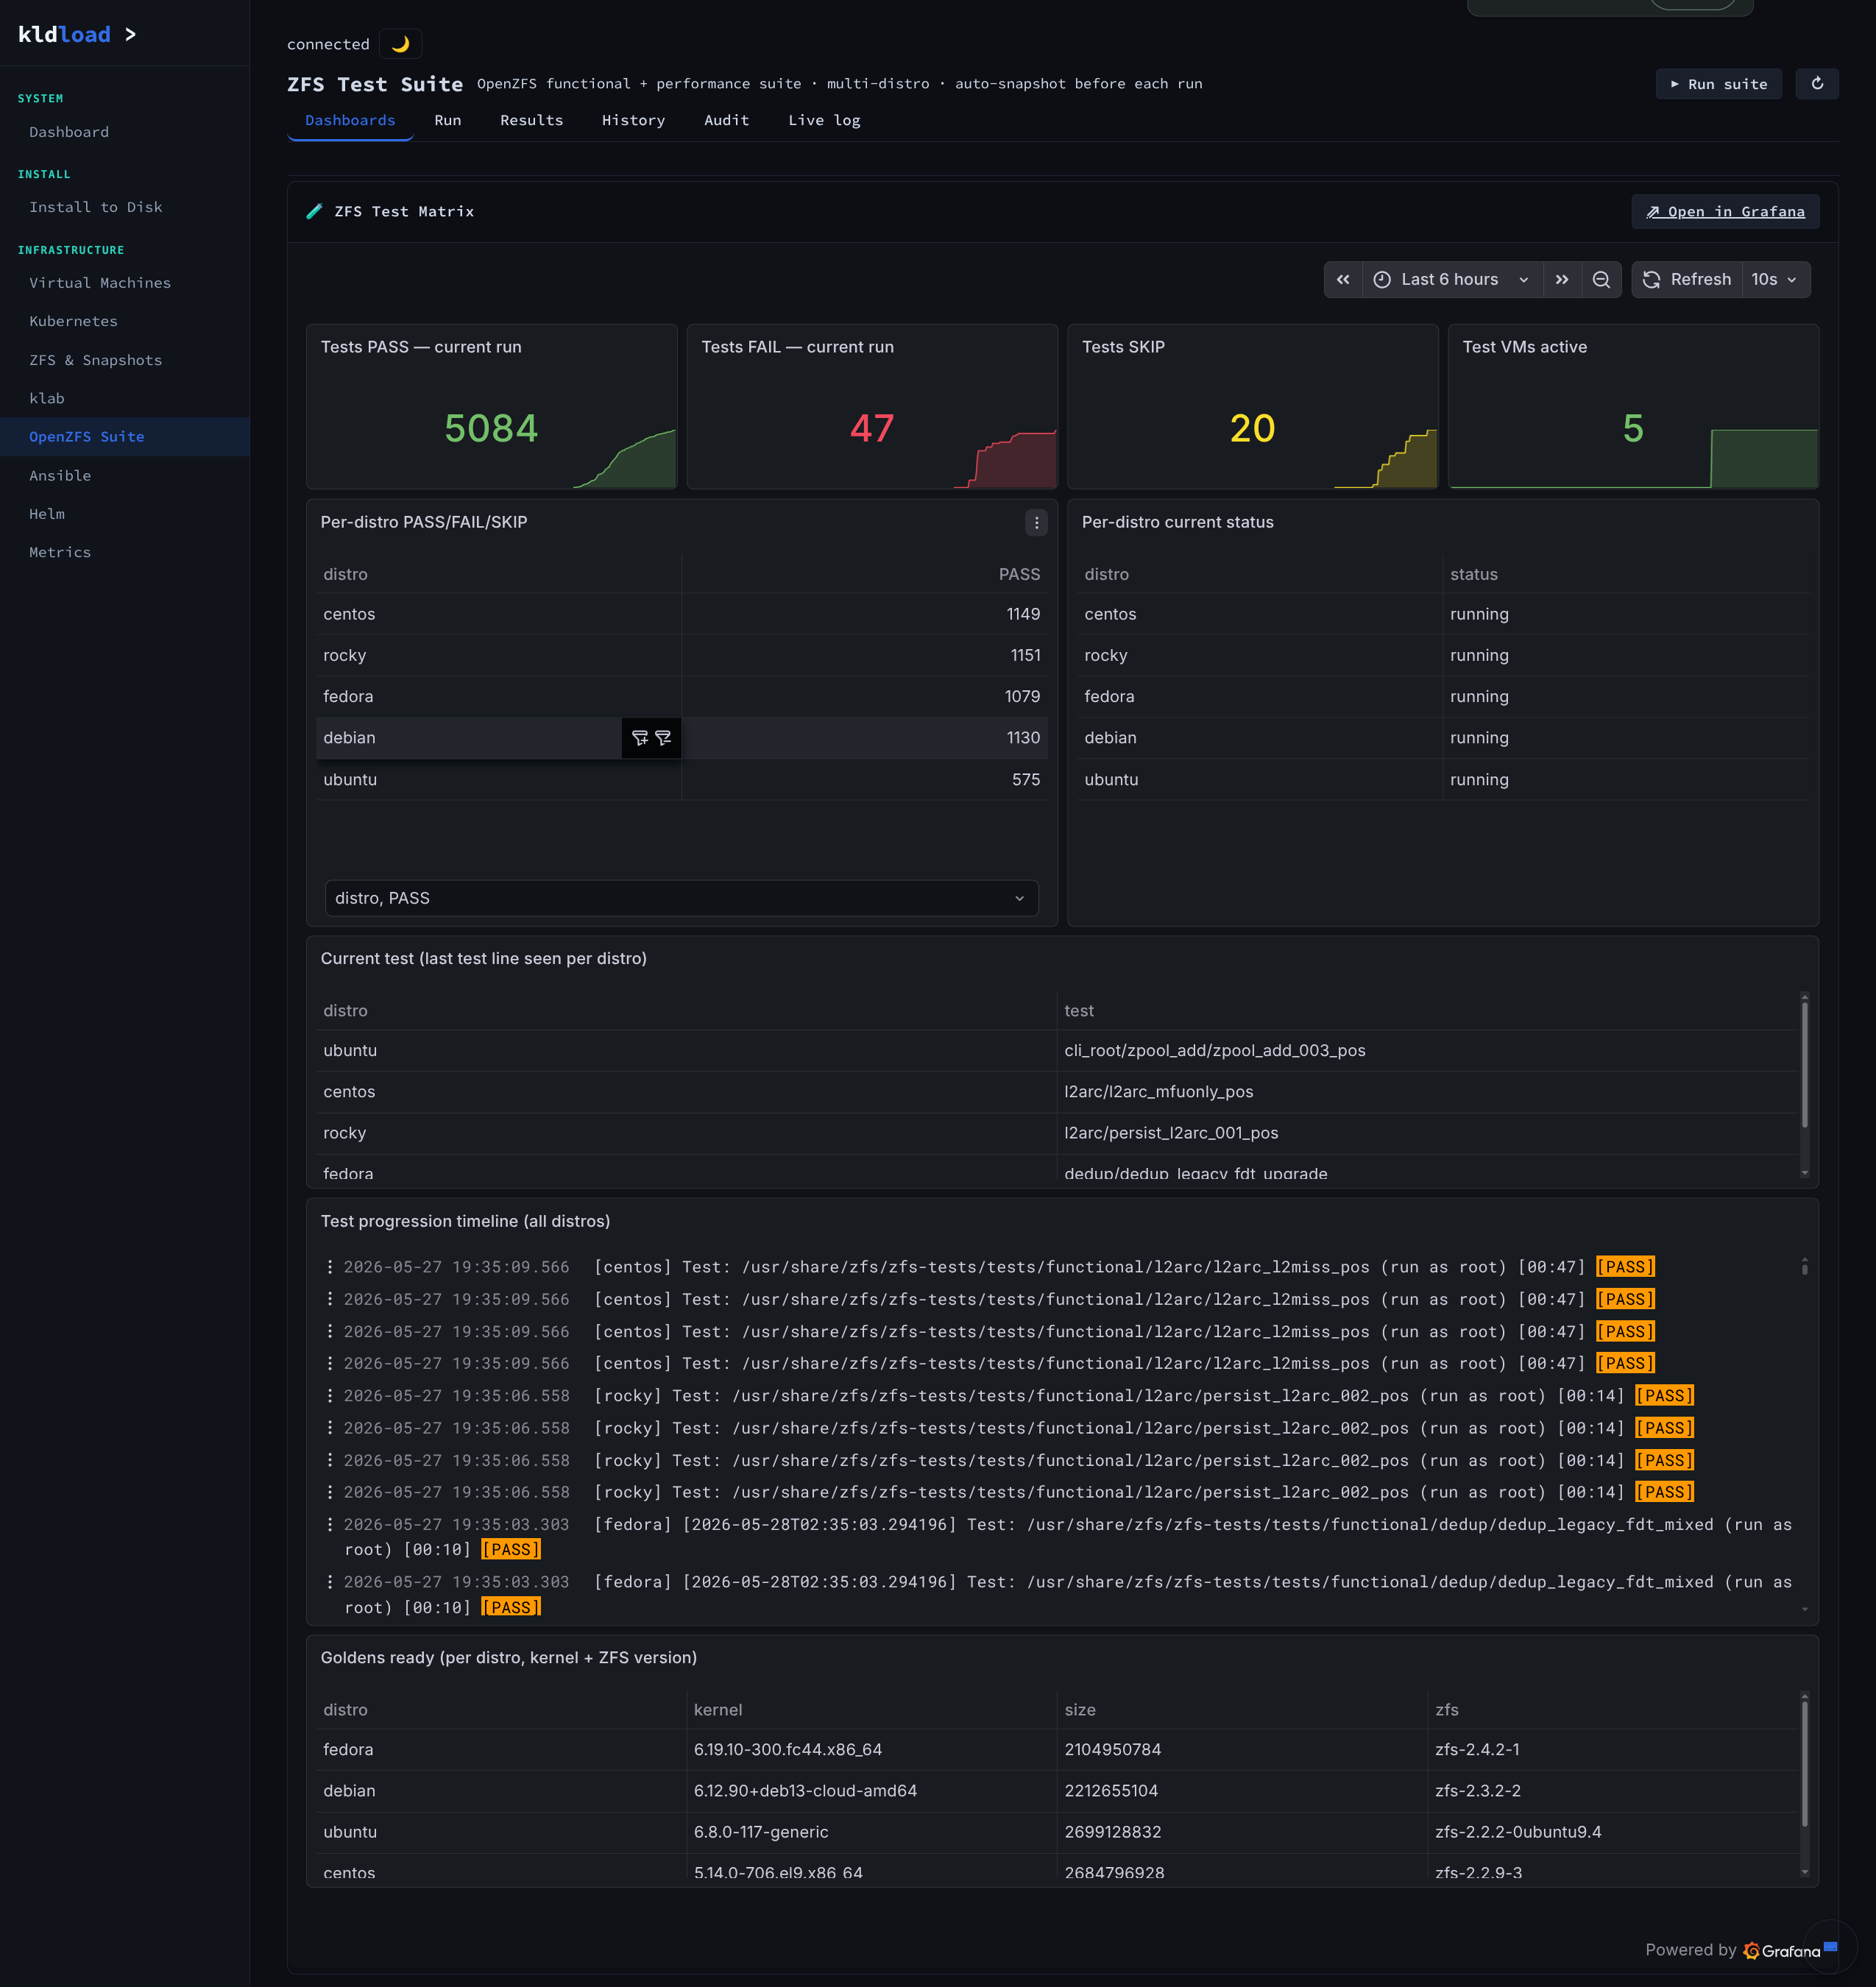
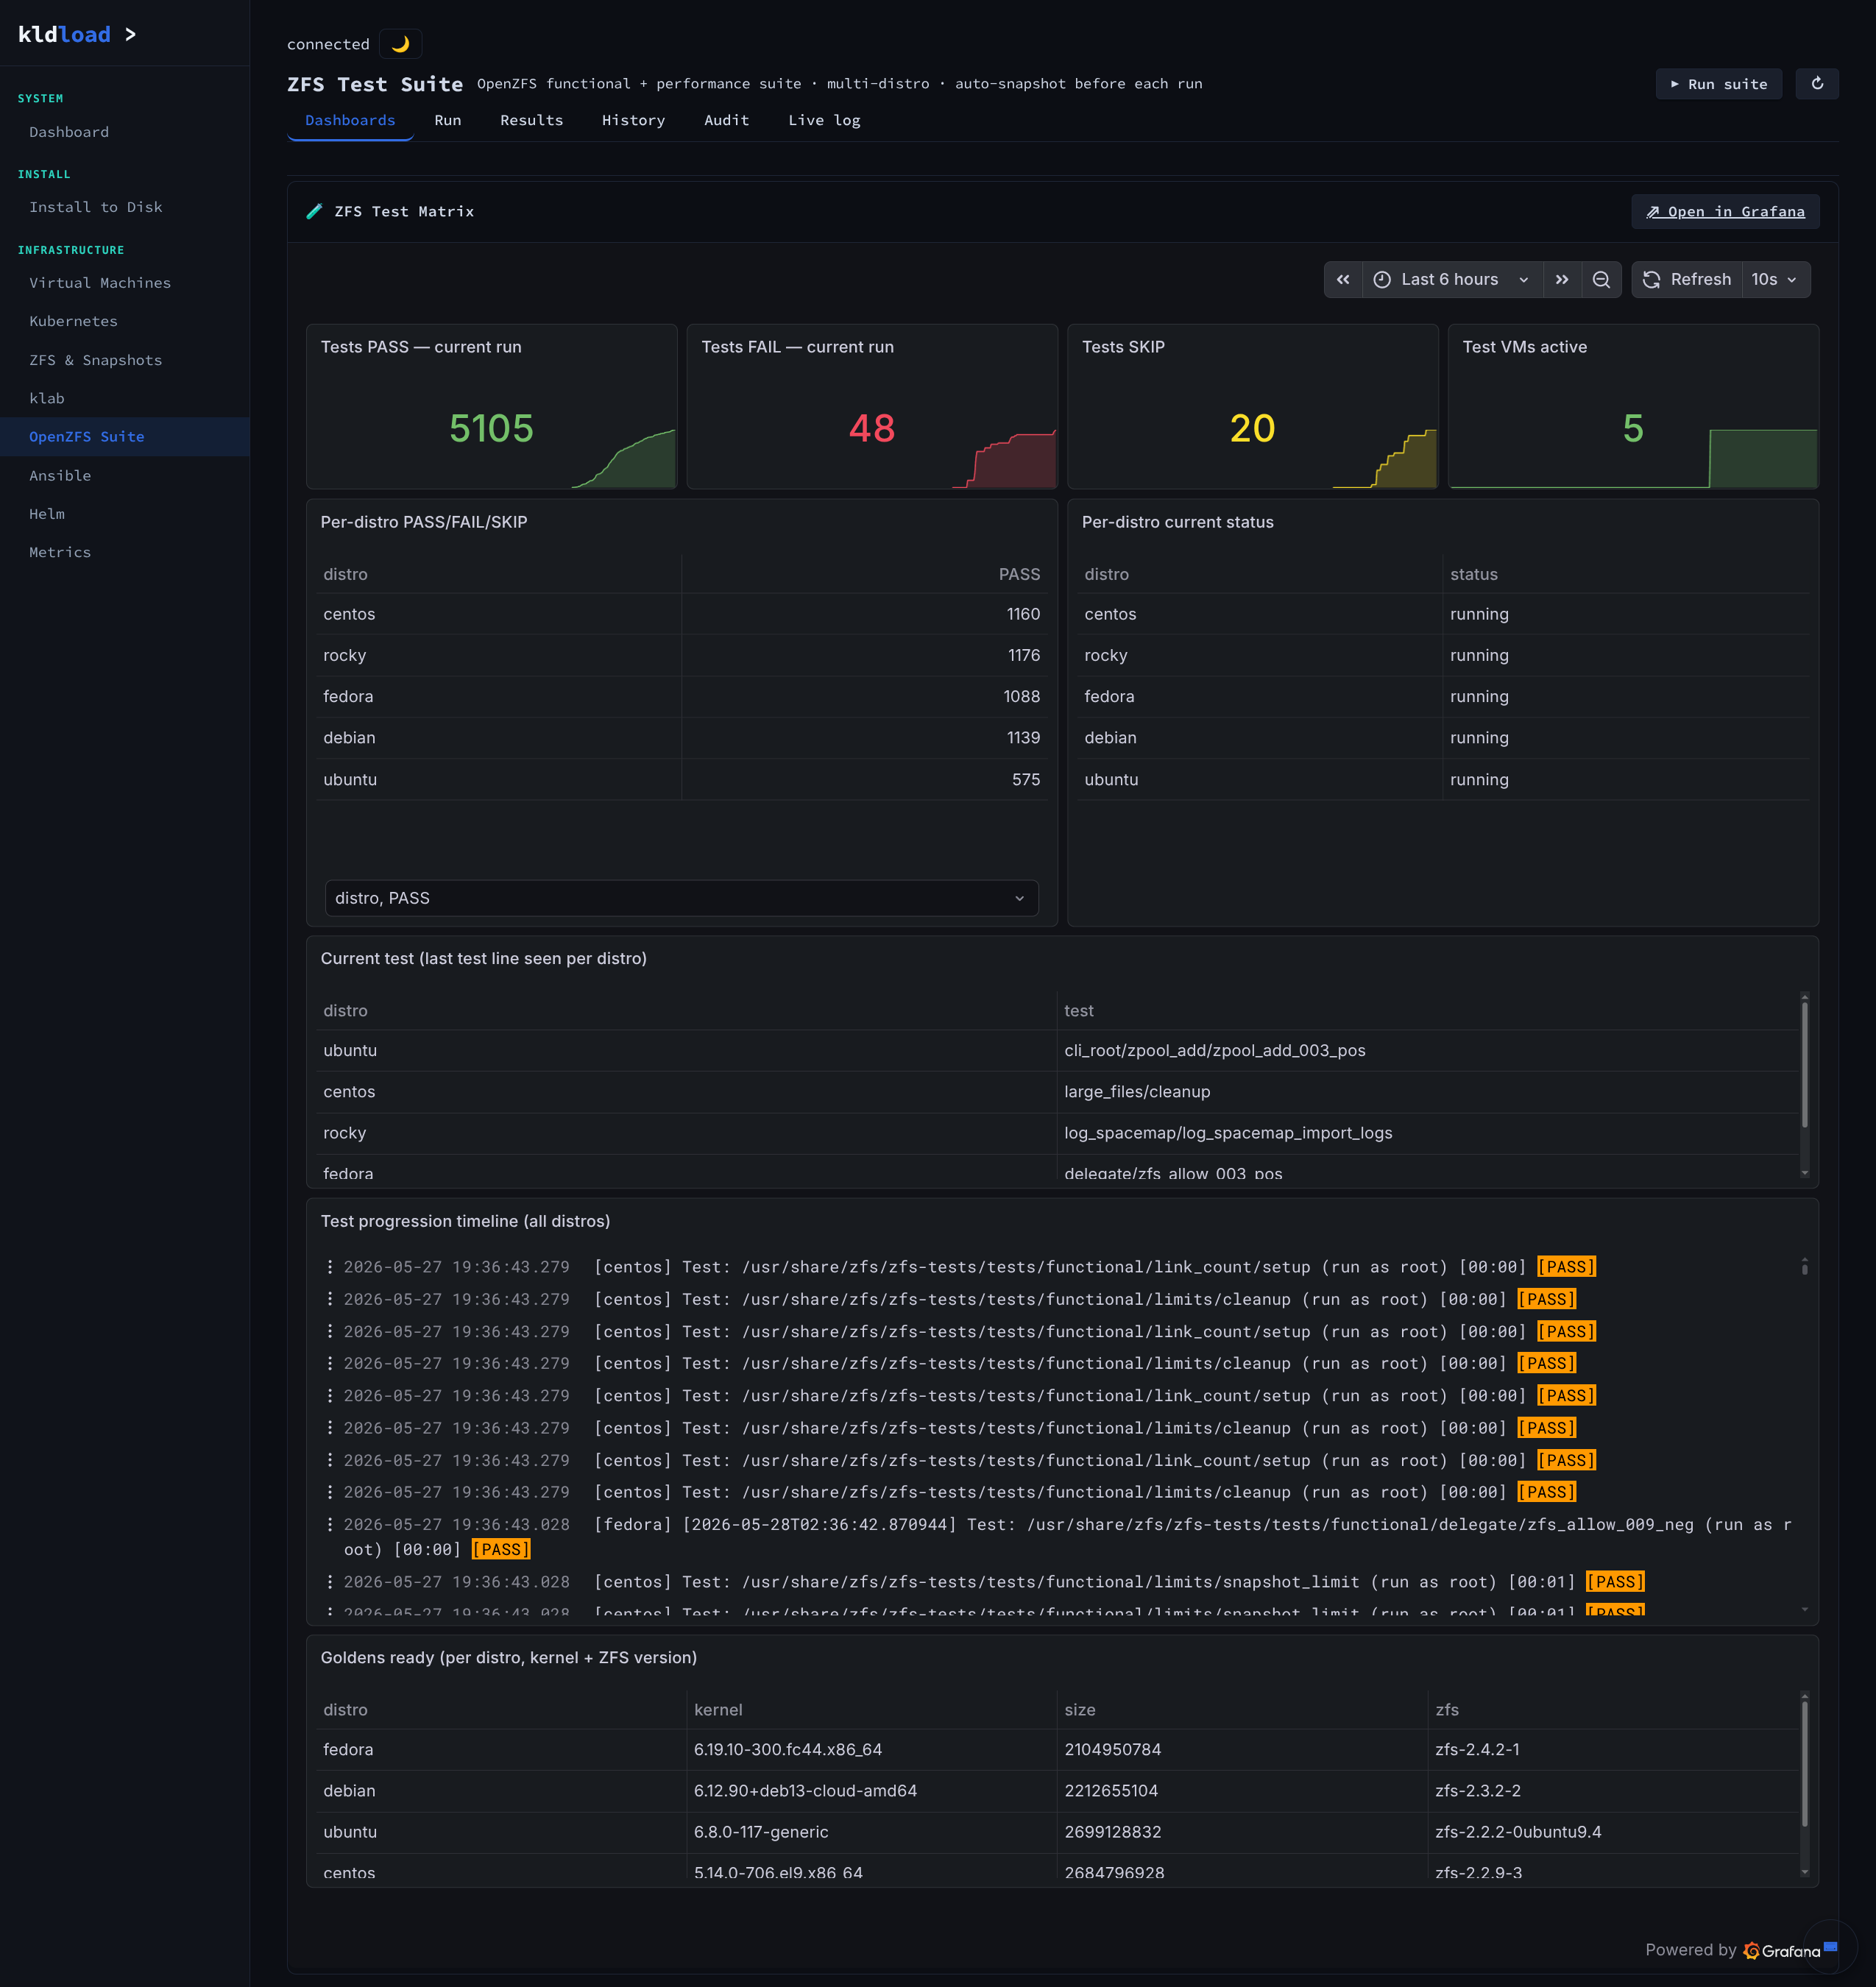
Per-distro counts roll up at the top: total PASS, total FAIL, total SKIP, dev-extra (tests added beyond upstream). Below that, the distro mix breakdown by test count, the per-distro test progression, the “tests that failed on more than one distro” surface that turns cross-distro divergence into an answerable question, and the live stream of test names at the bottom. The screen you screenshot and send to the OpenZFS issue tracker.
Live log — the test names scrolling by
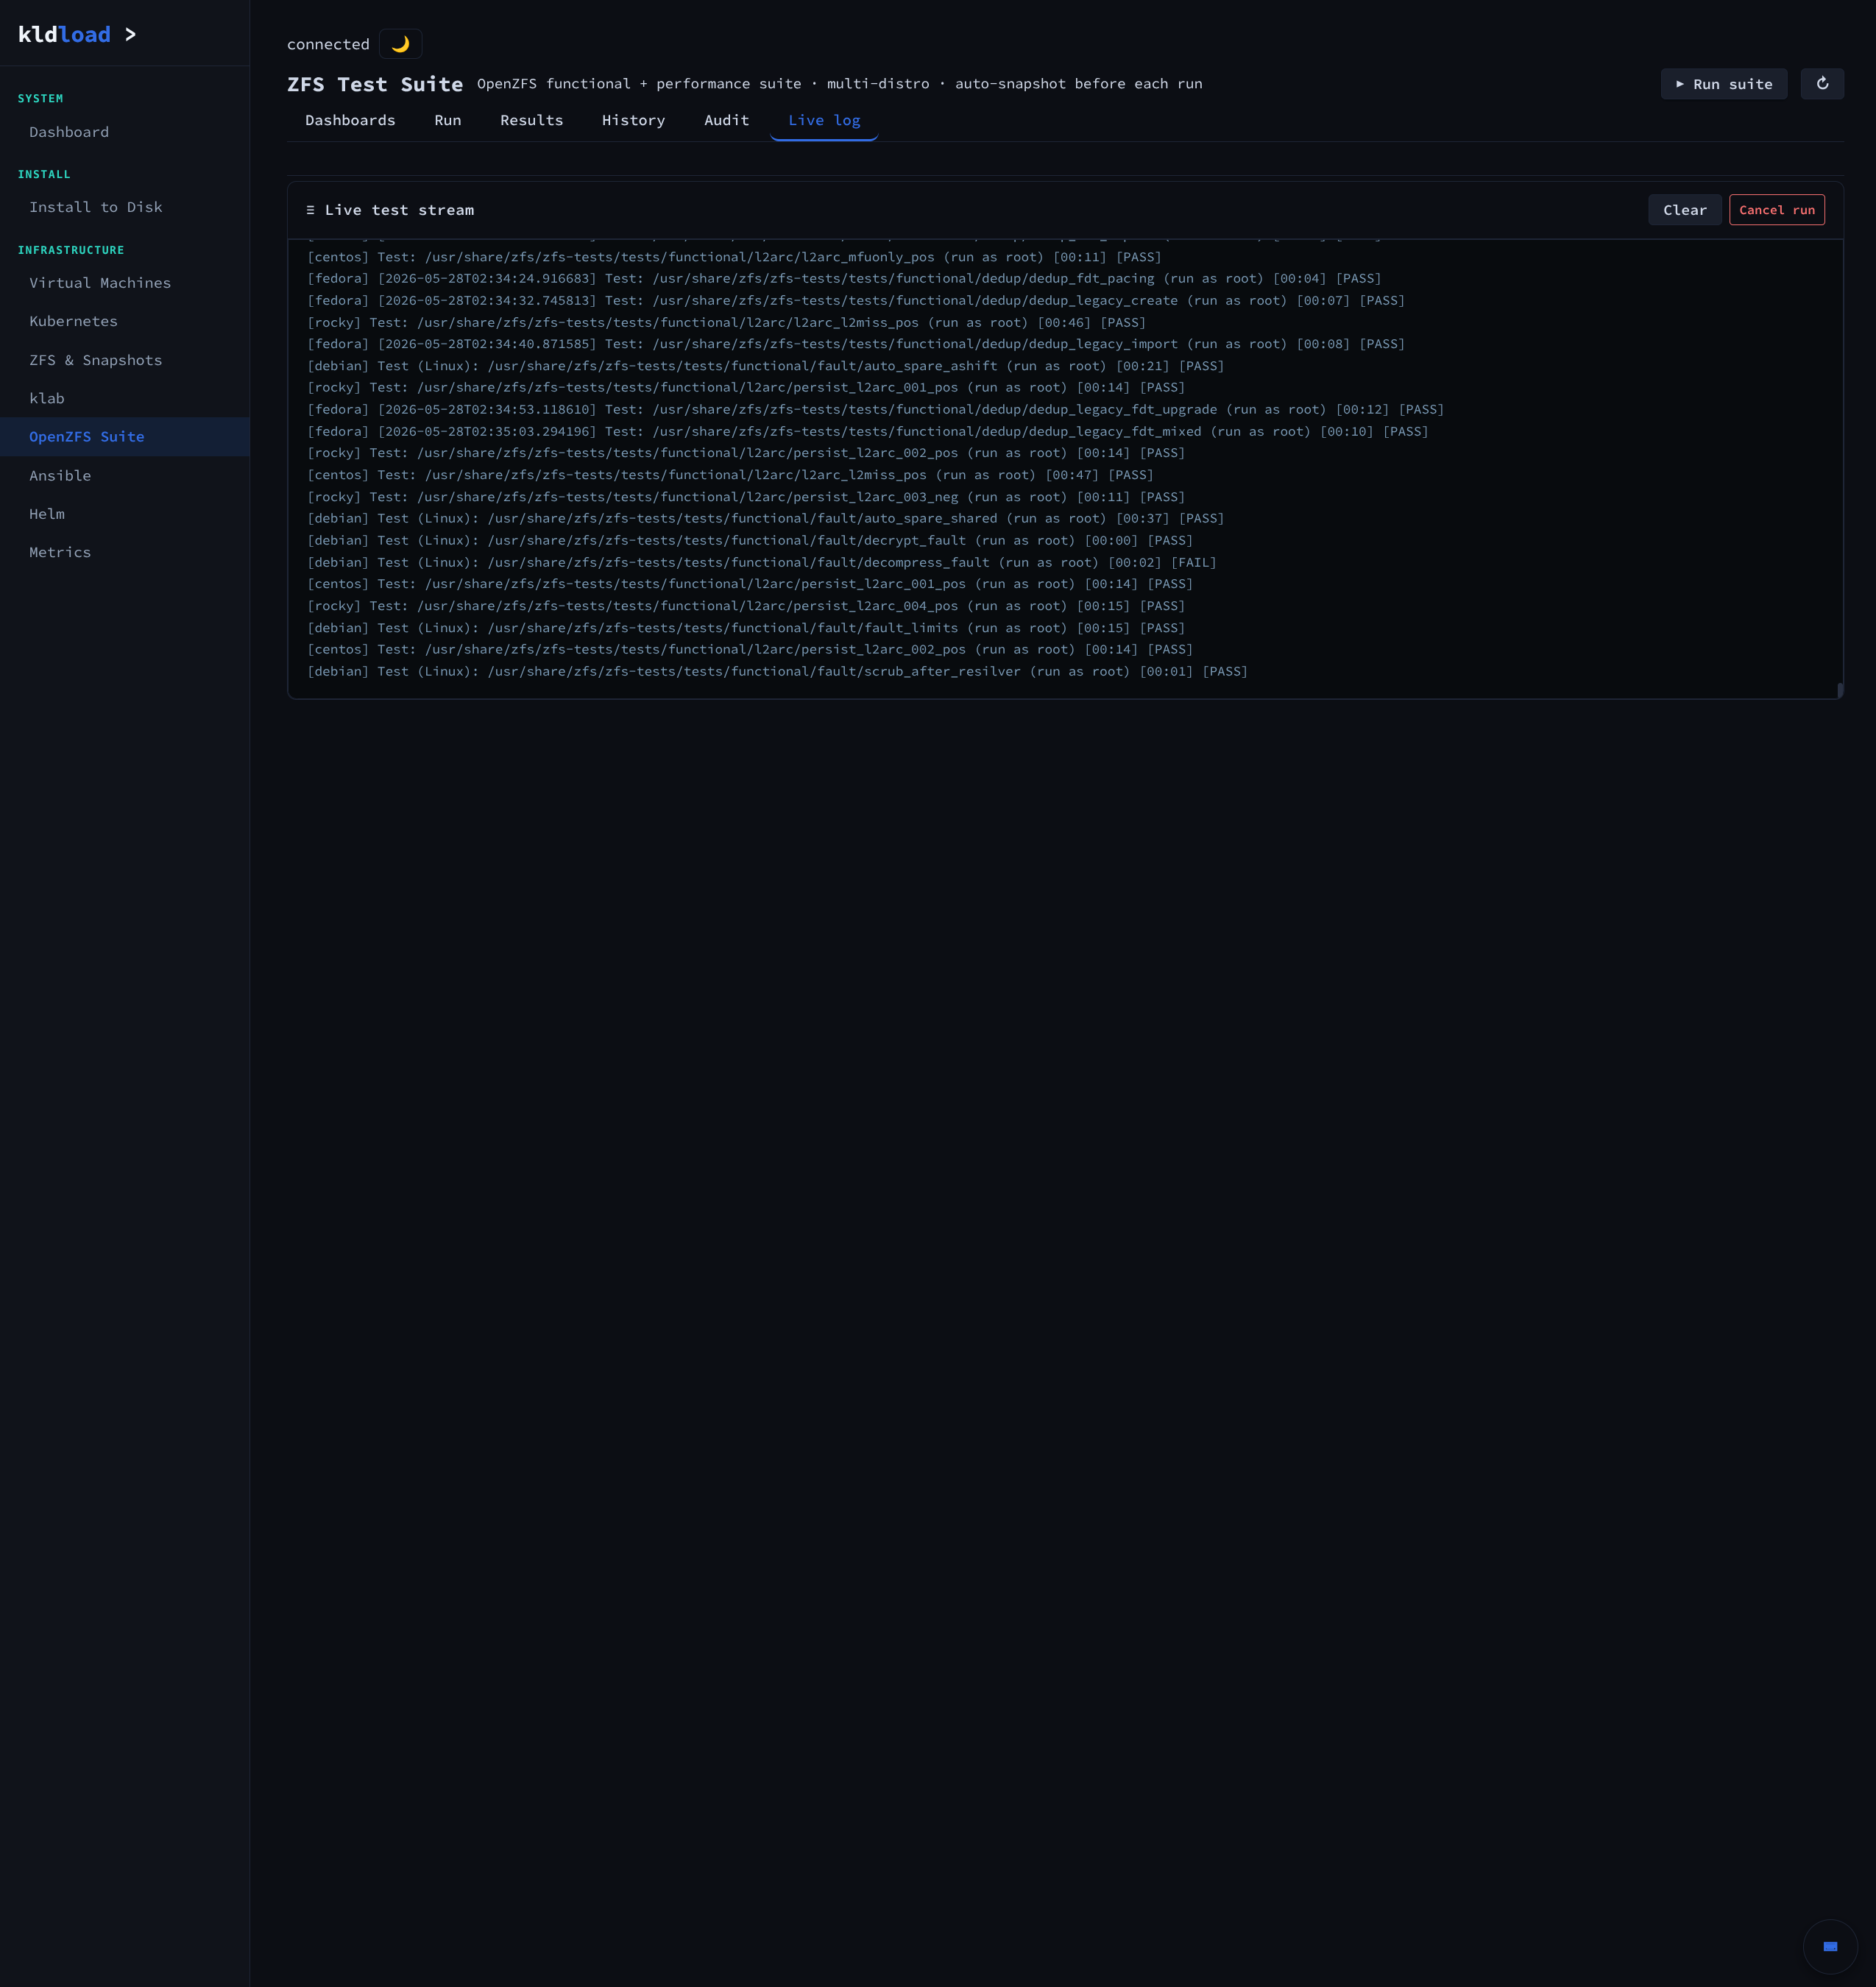
The streaming log of test names with their PASS/FAIL/SKIP tag, one per line, per distro — [centos], [rocky], [fedora], [debian], [ubuntu]. The forensic surface for the moment a specific test starts misbehaving on a specific distro. Same data the upstream OpenZFS CI surfaces, but you own the host.
Ansible
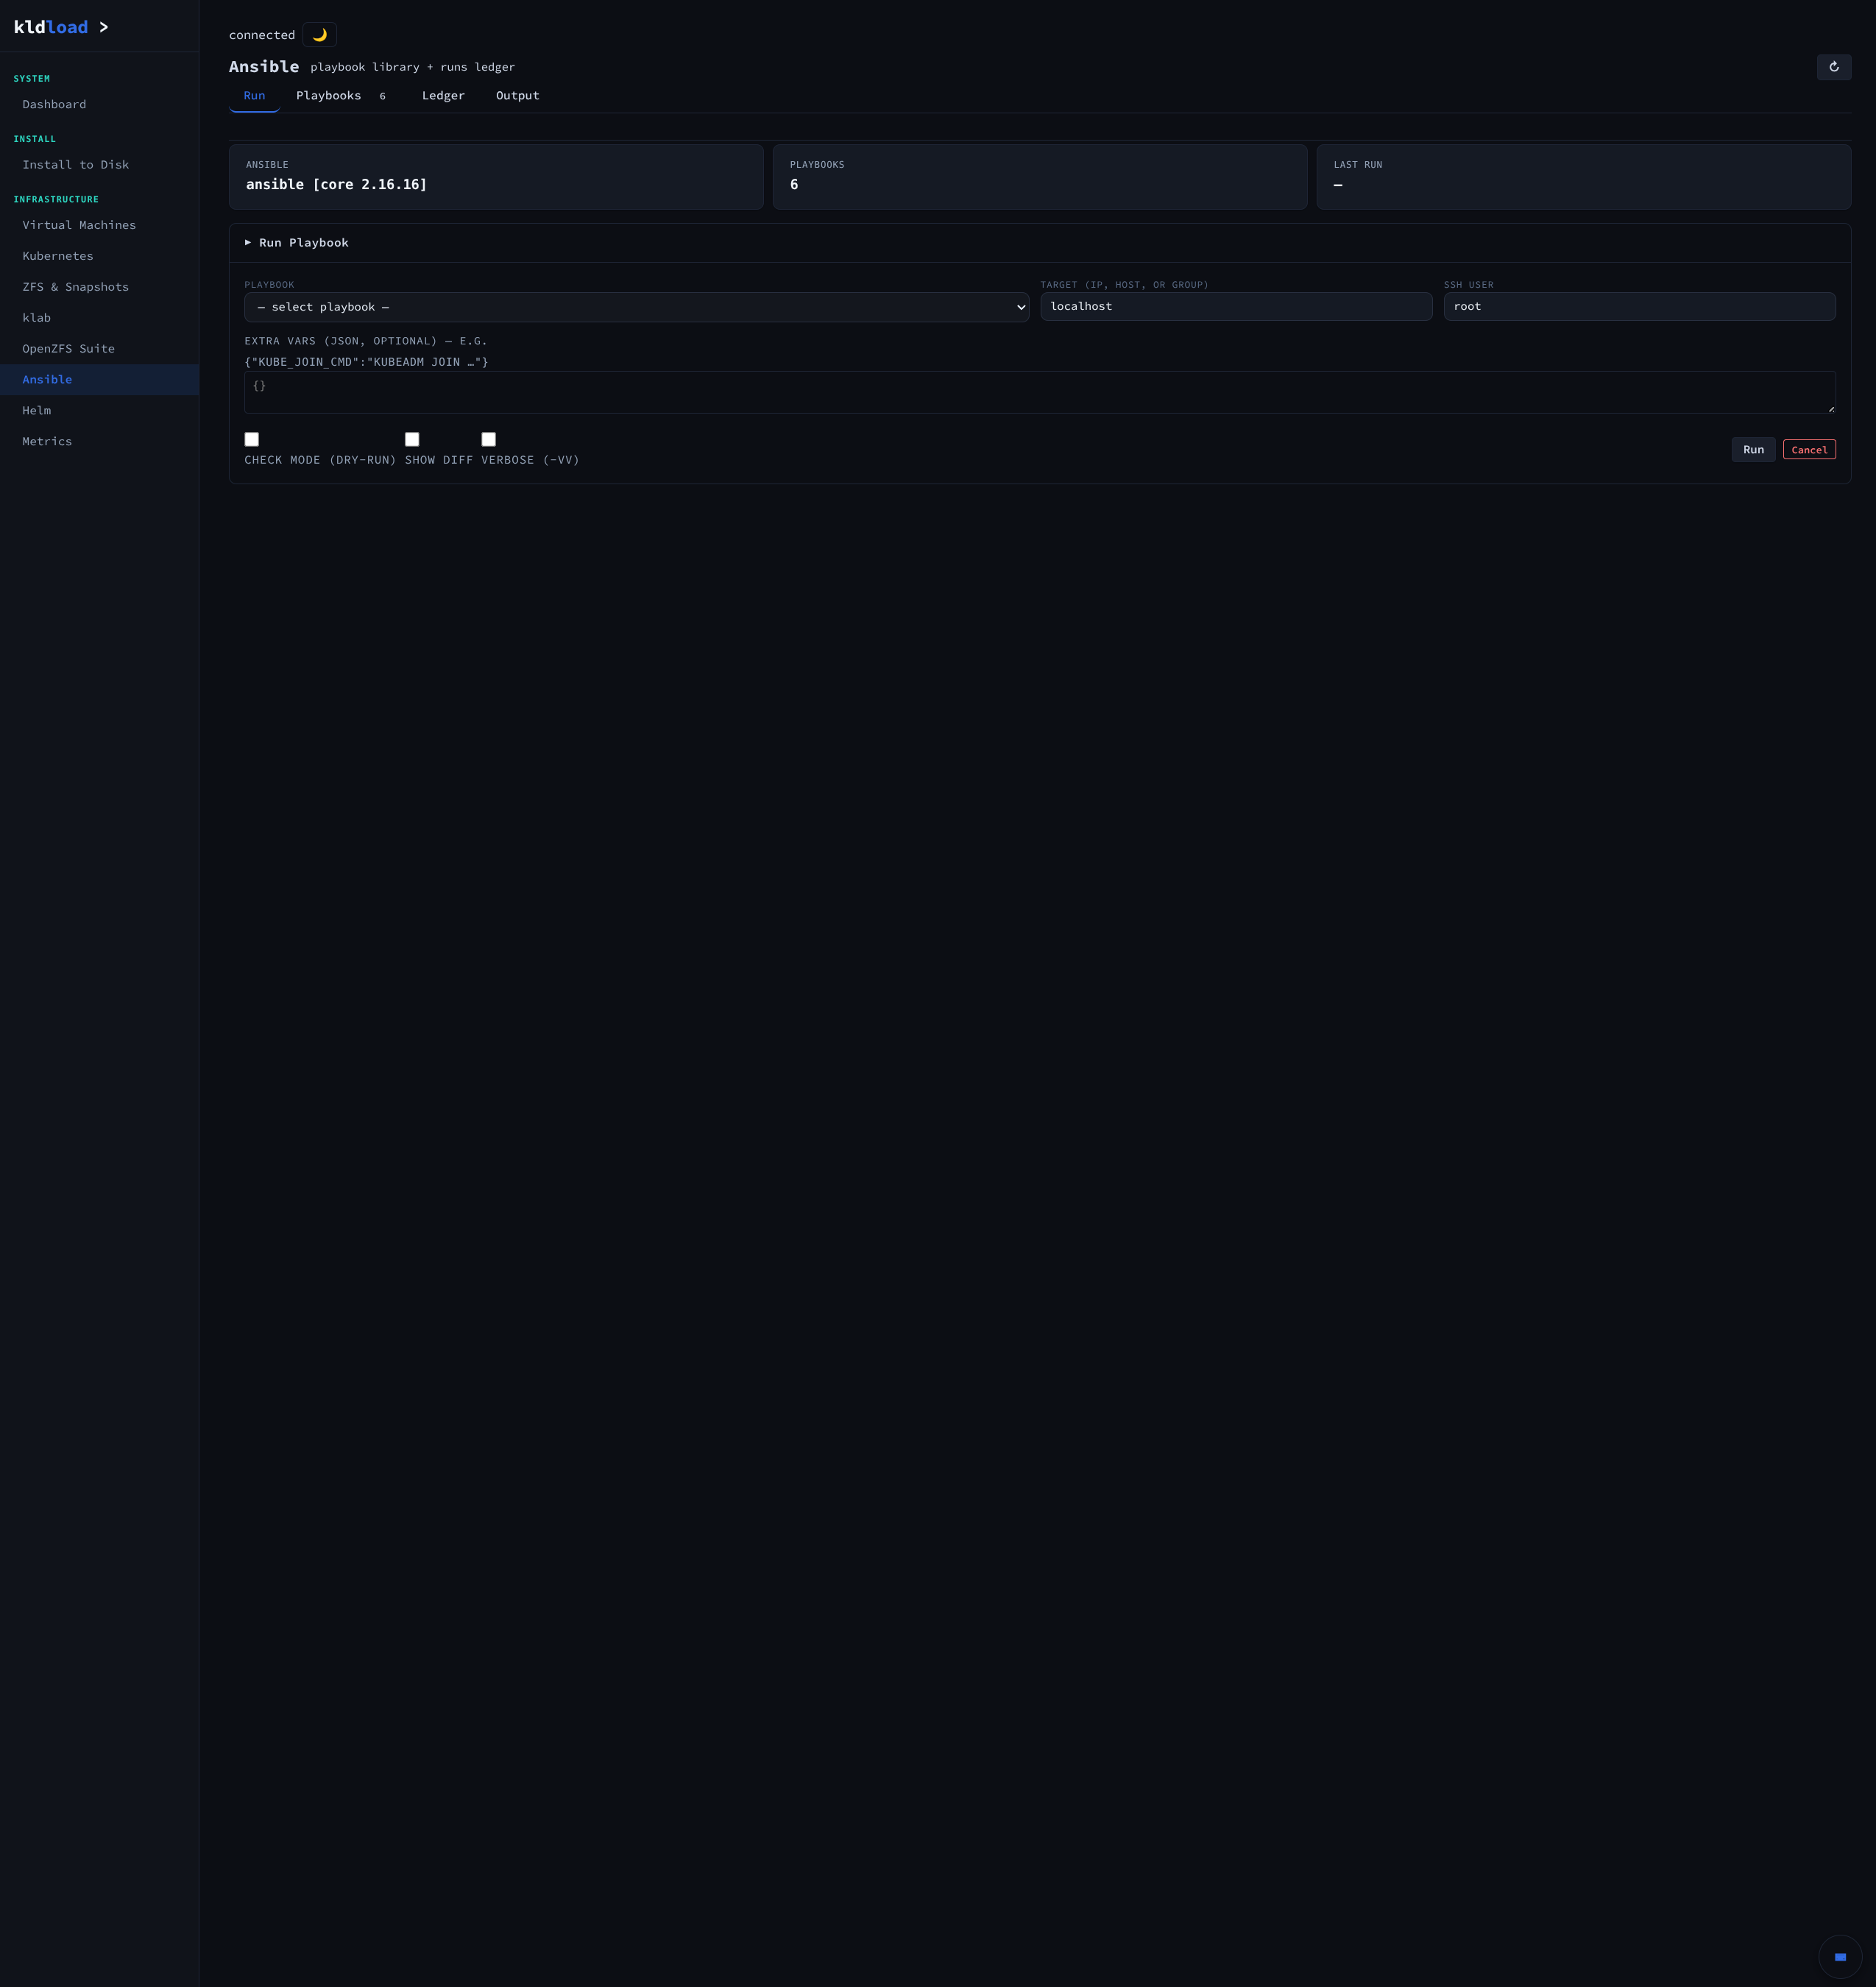
Wired in but never required. Ansible is the “for when you outgrow point-and-click” layer, not a gate you have to learn first. Every action in the web UI emits a playbook fragment you can save, version, and replay across hosts. The web UI doesn’t fight Ansible; Ansible doesn’t fight the web UI. The two are the same control plane viewed from two different ergonomics.
Run, Playbooks, Ledger
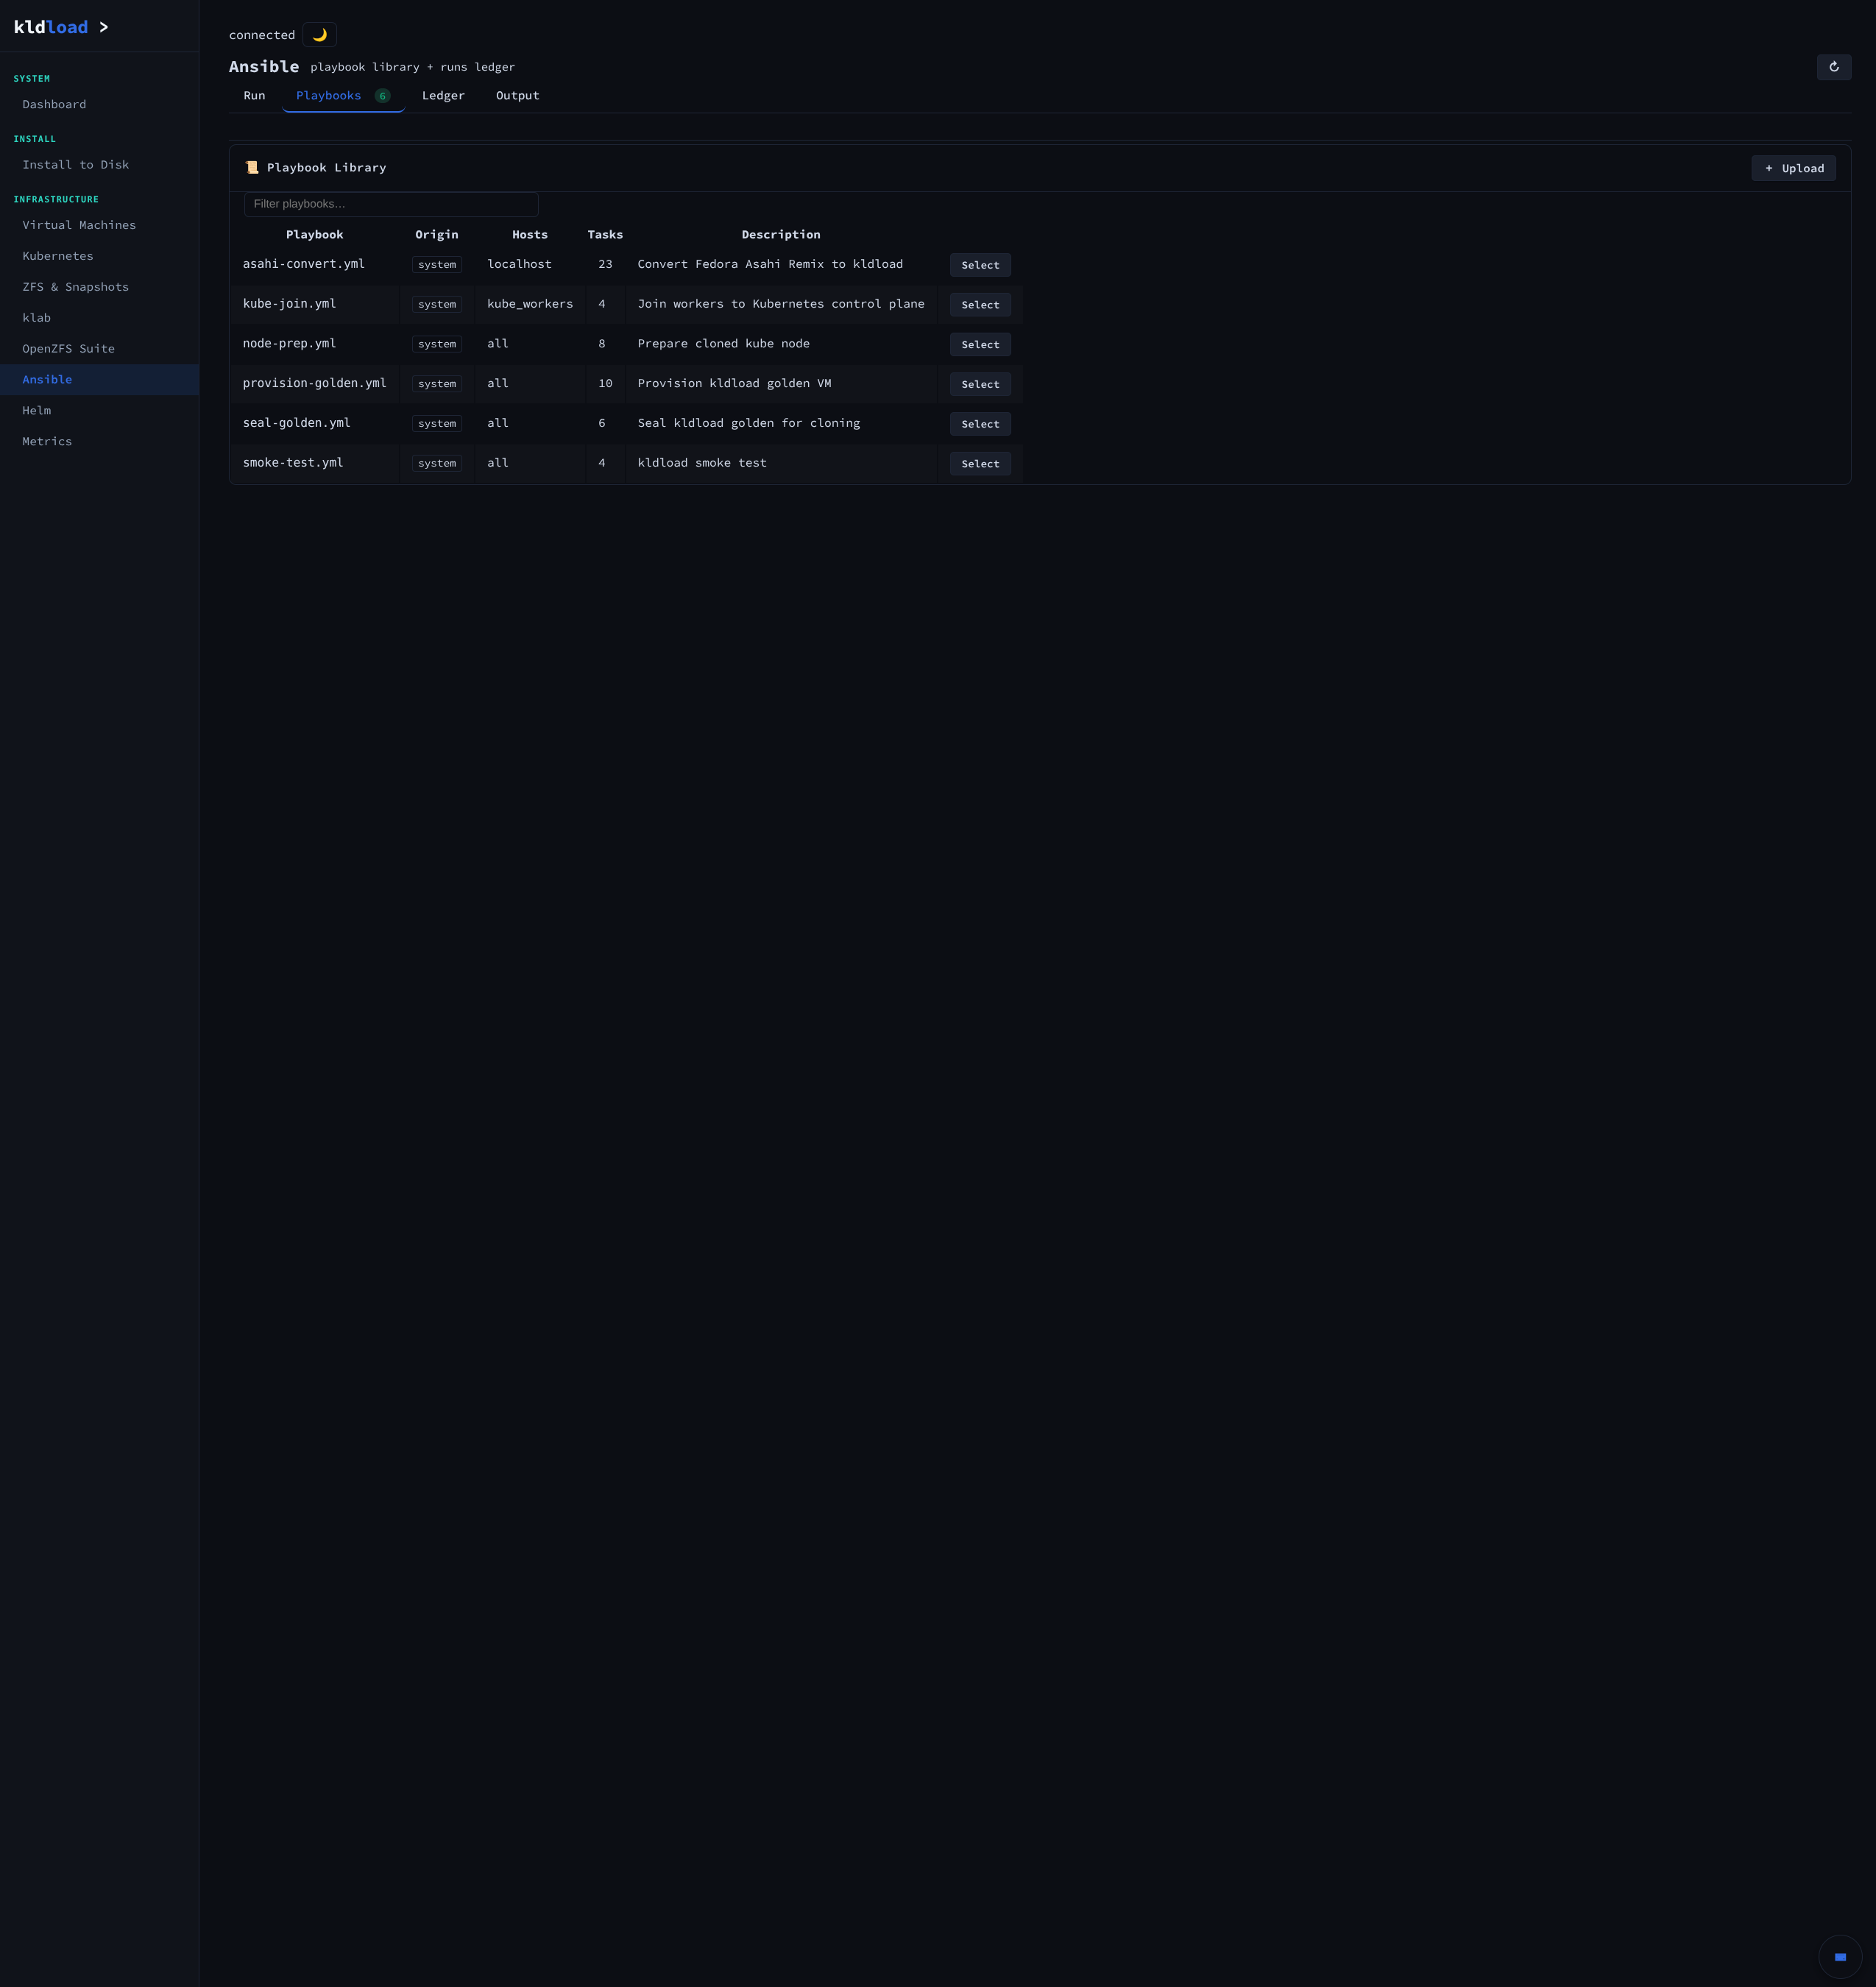
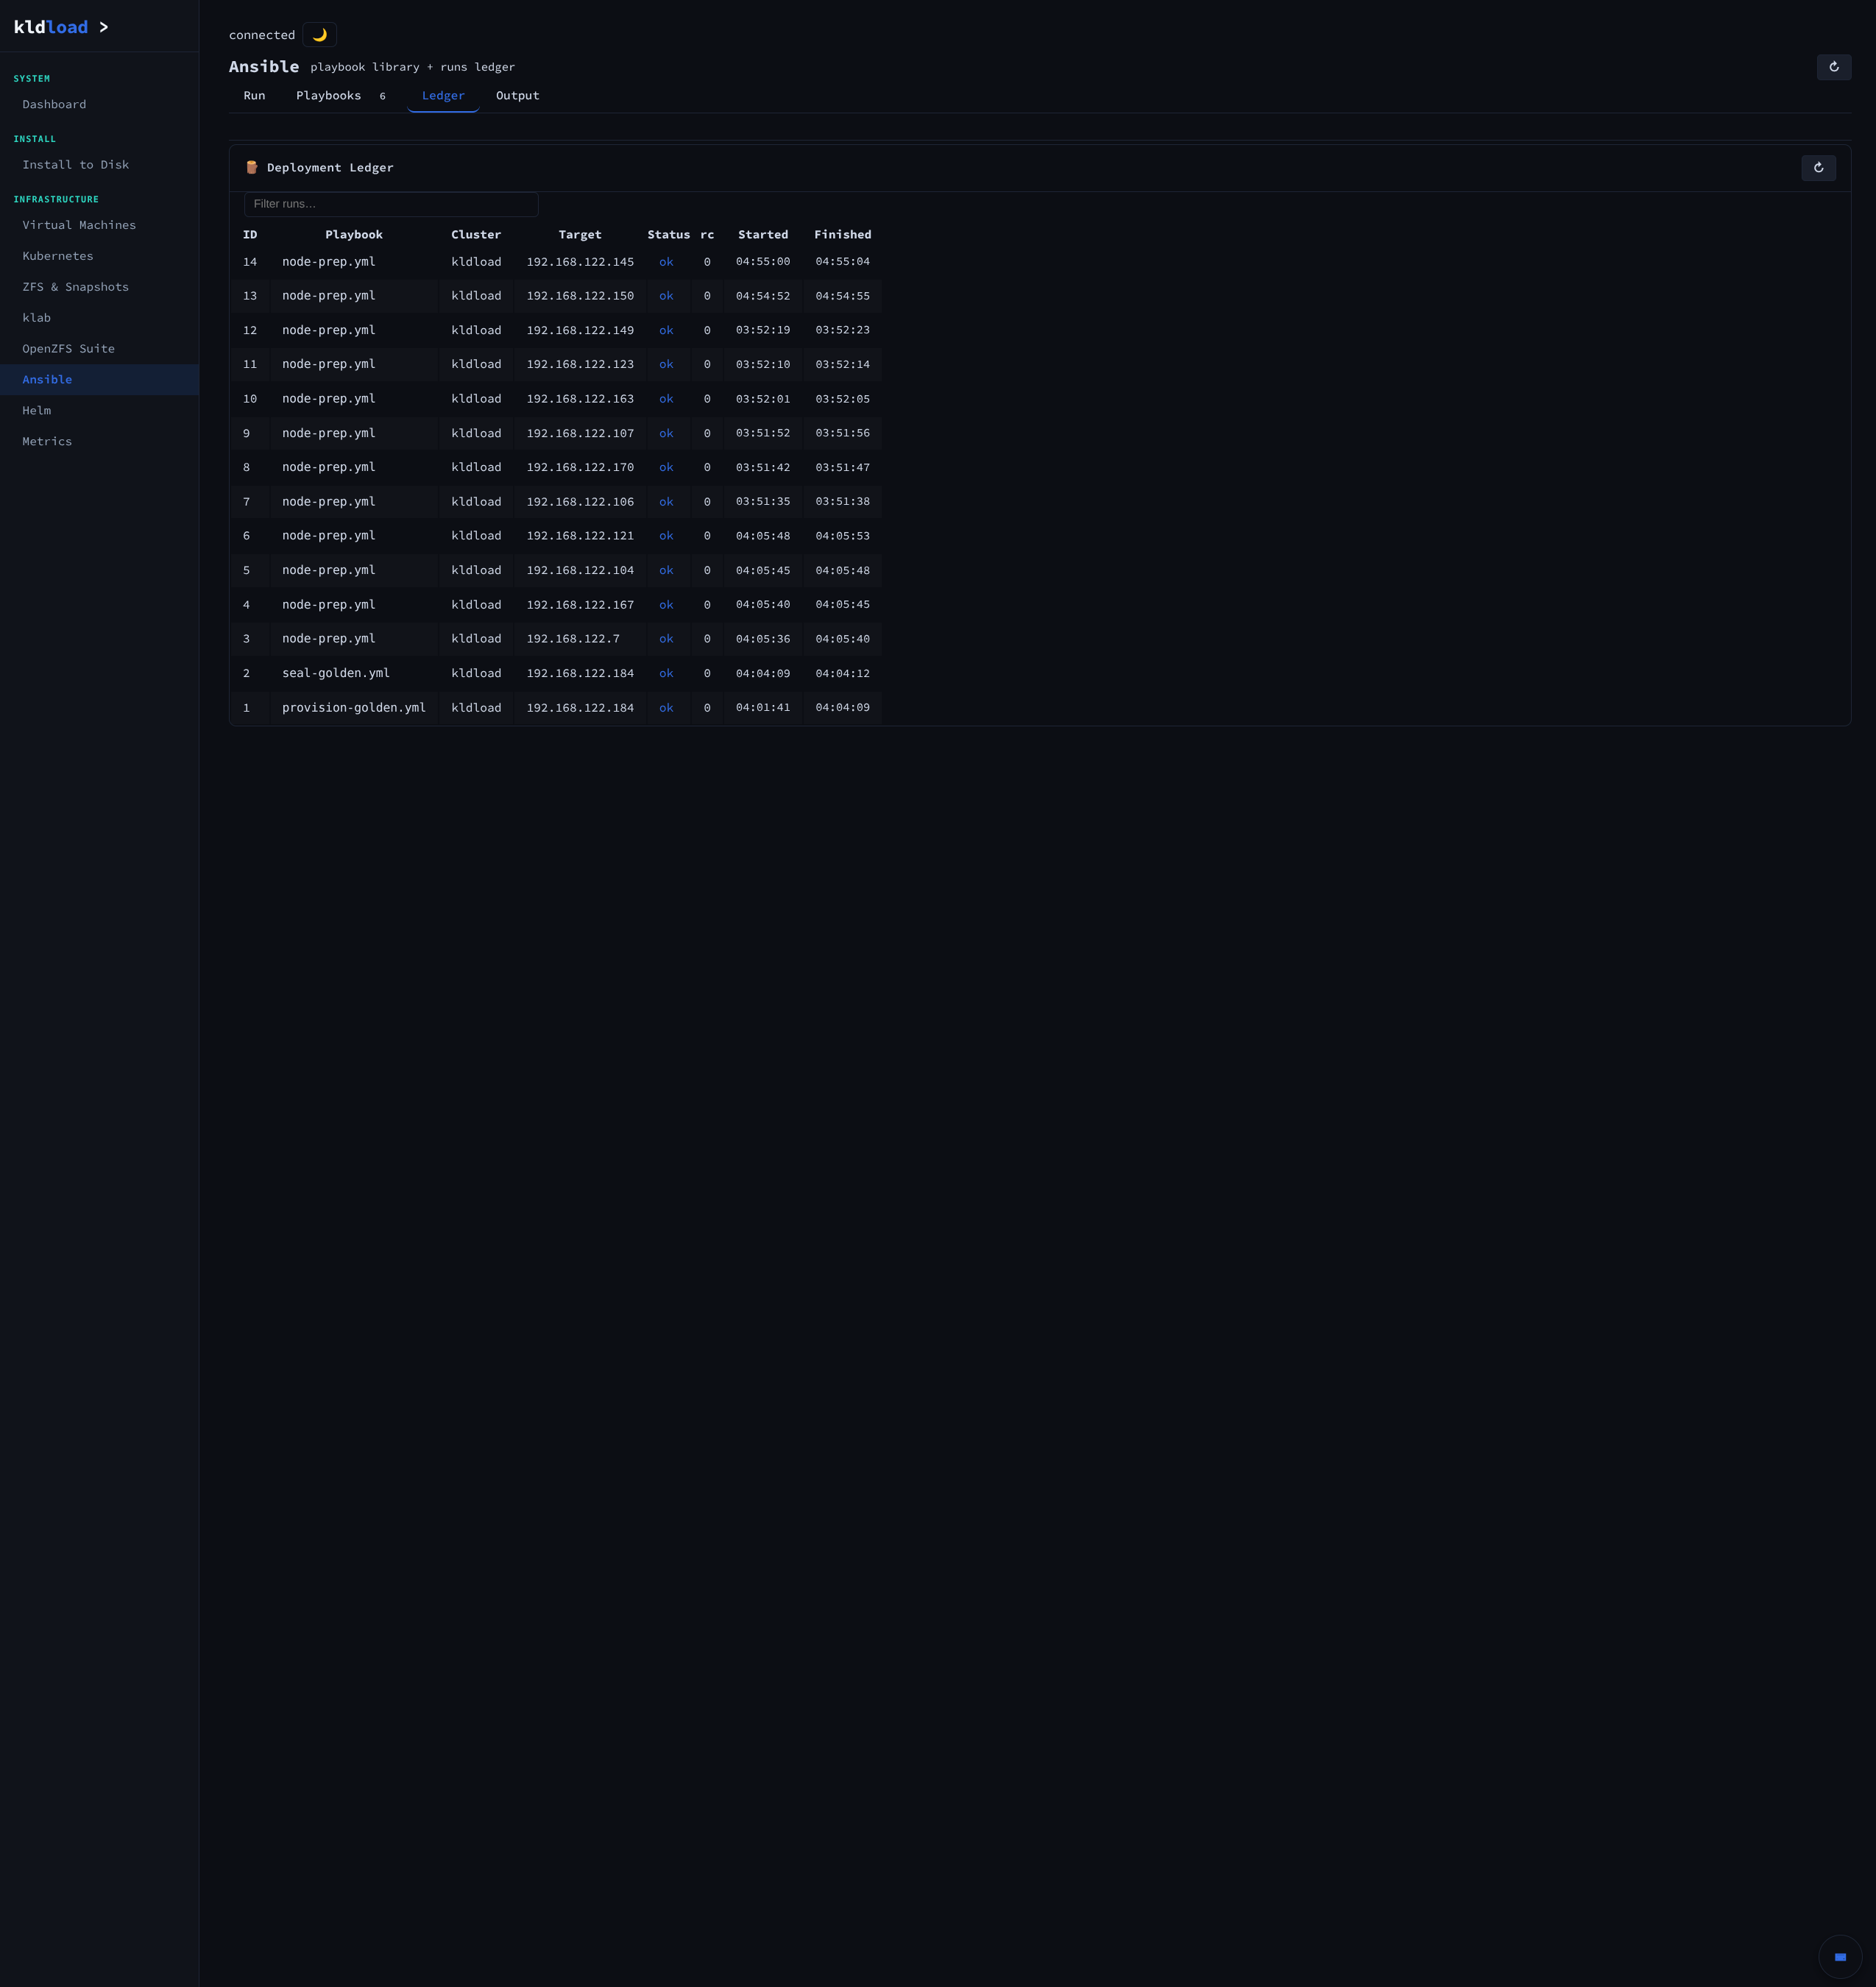
Run (the runner: pick playbook, target, extra vars), Playbooks (the shipped library: asahi-convert, kube-join, node-prep, provision-golden, seal-golden, smoke-test — real plays you can read and fork), Ledger (the deployment ledger — every run, every host, every exit code, every duration).
Helm
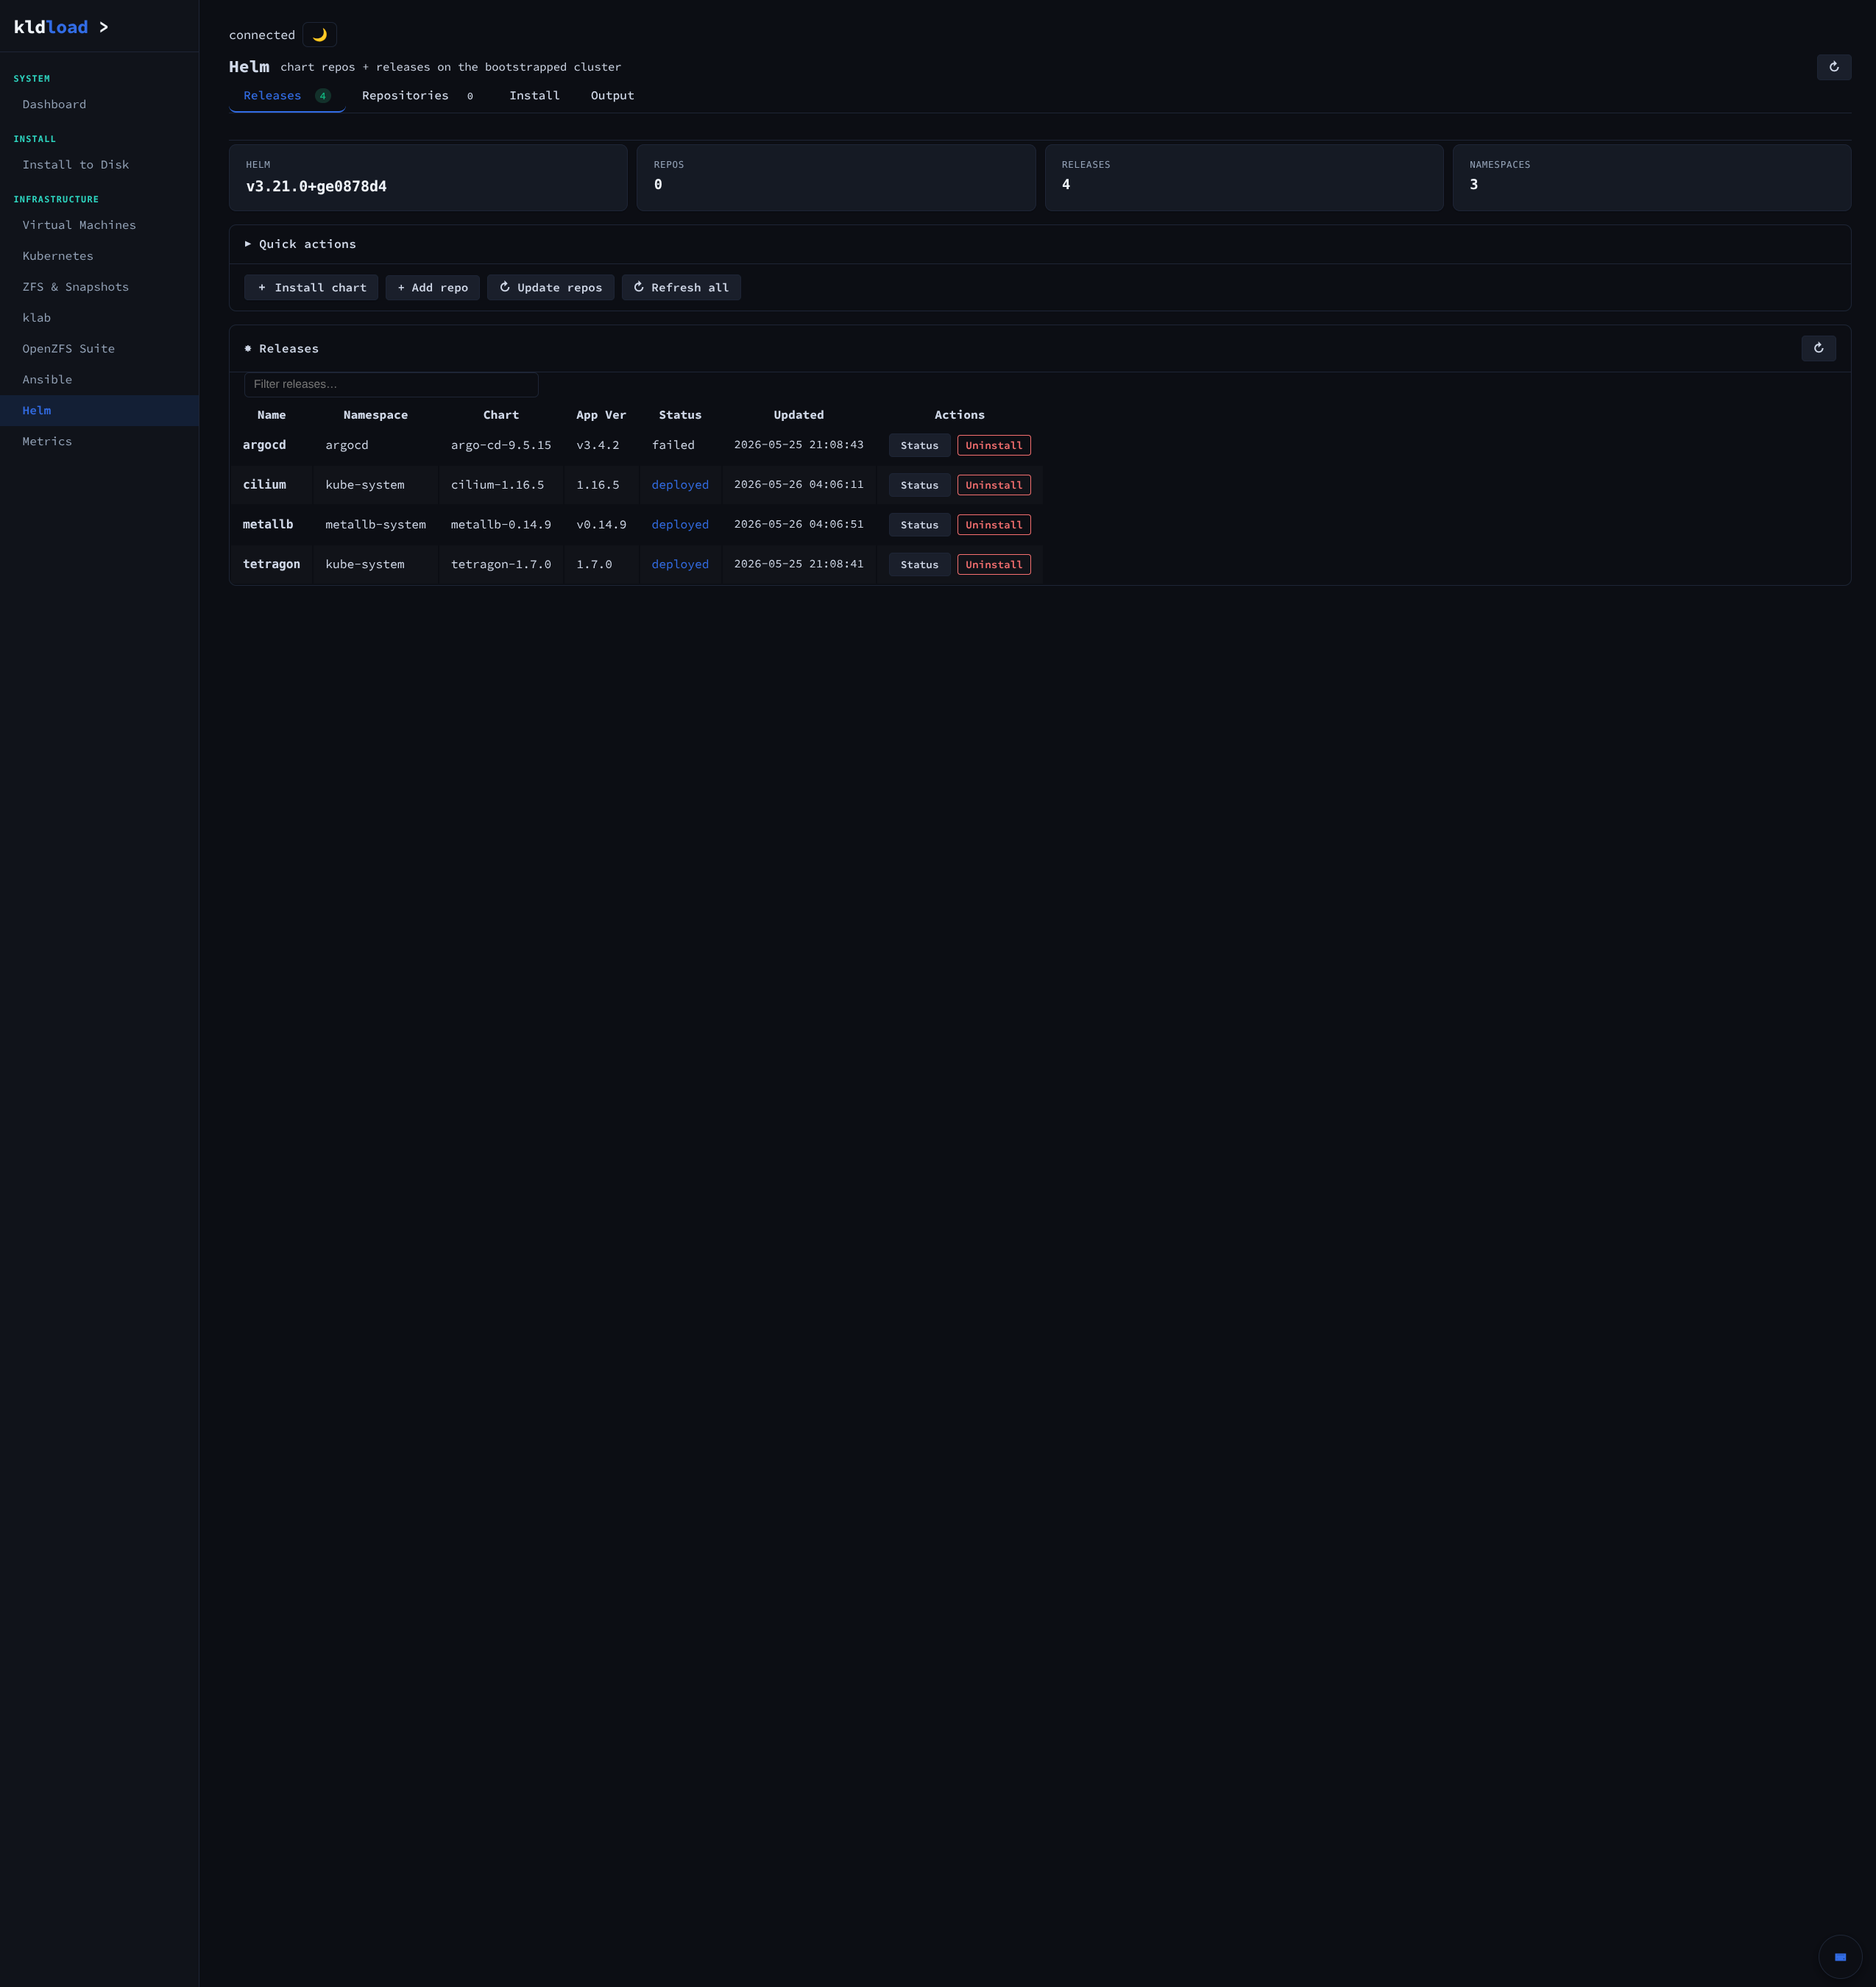
Same idea as Ansible at the K8s layer. Helm is there when you want it, not in the way when you don’t. The chart browser and the install form live alongside the cluster view, but you can also just helm install from the shell — the web UI watches and reflects whatever you do there. No lock-in to the click path.
Releases, Repositories, Install
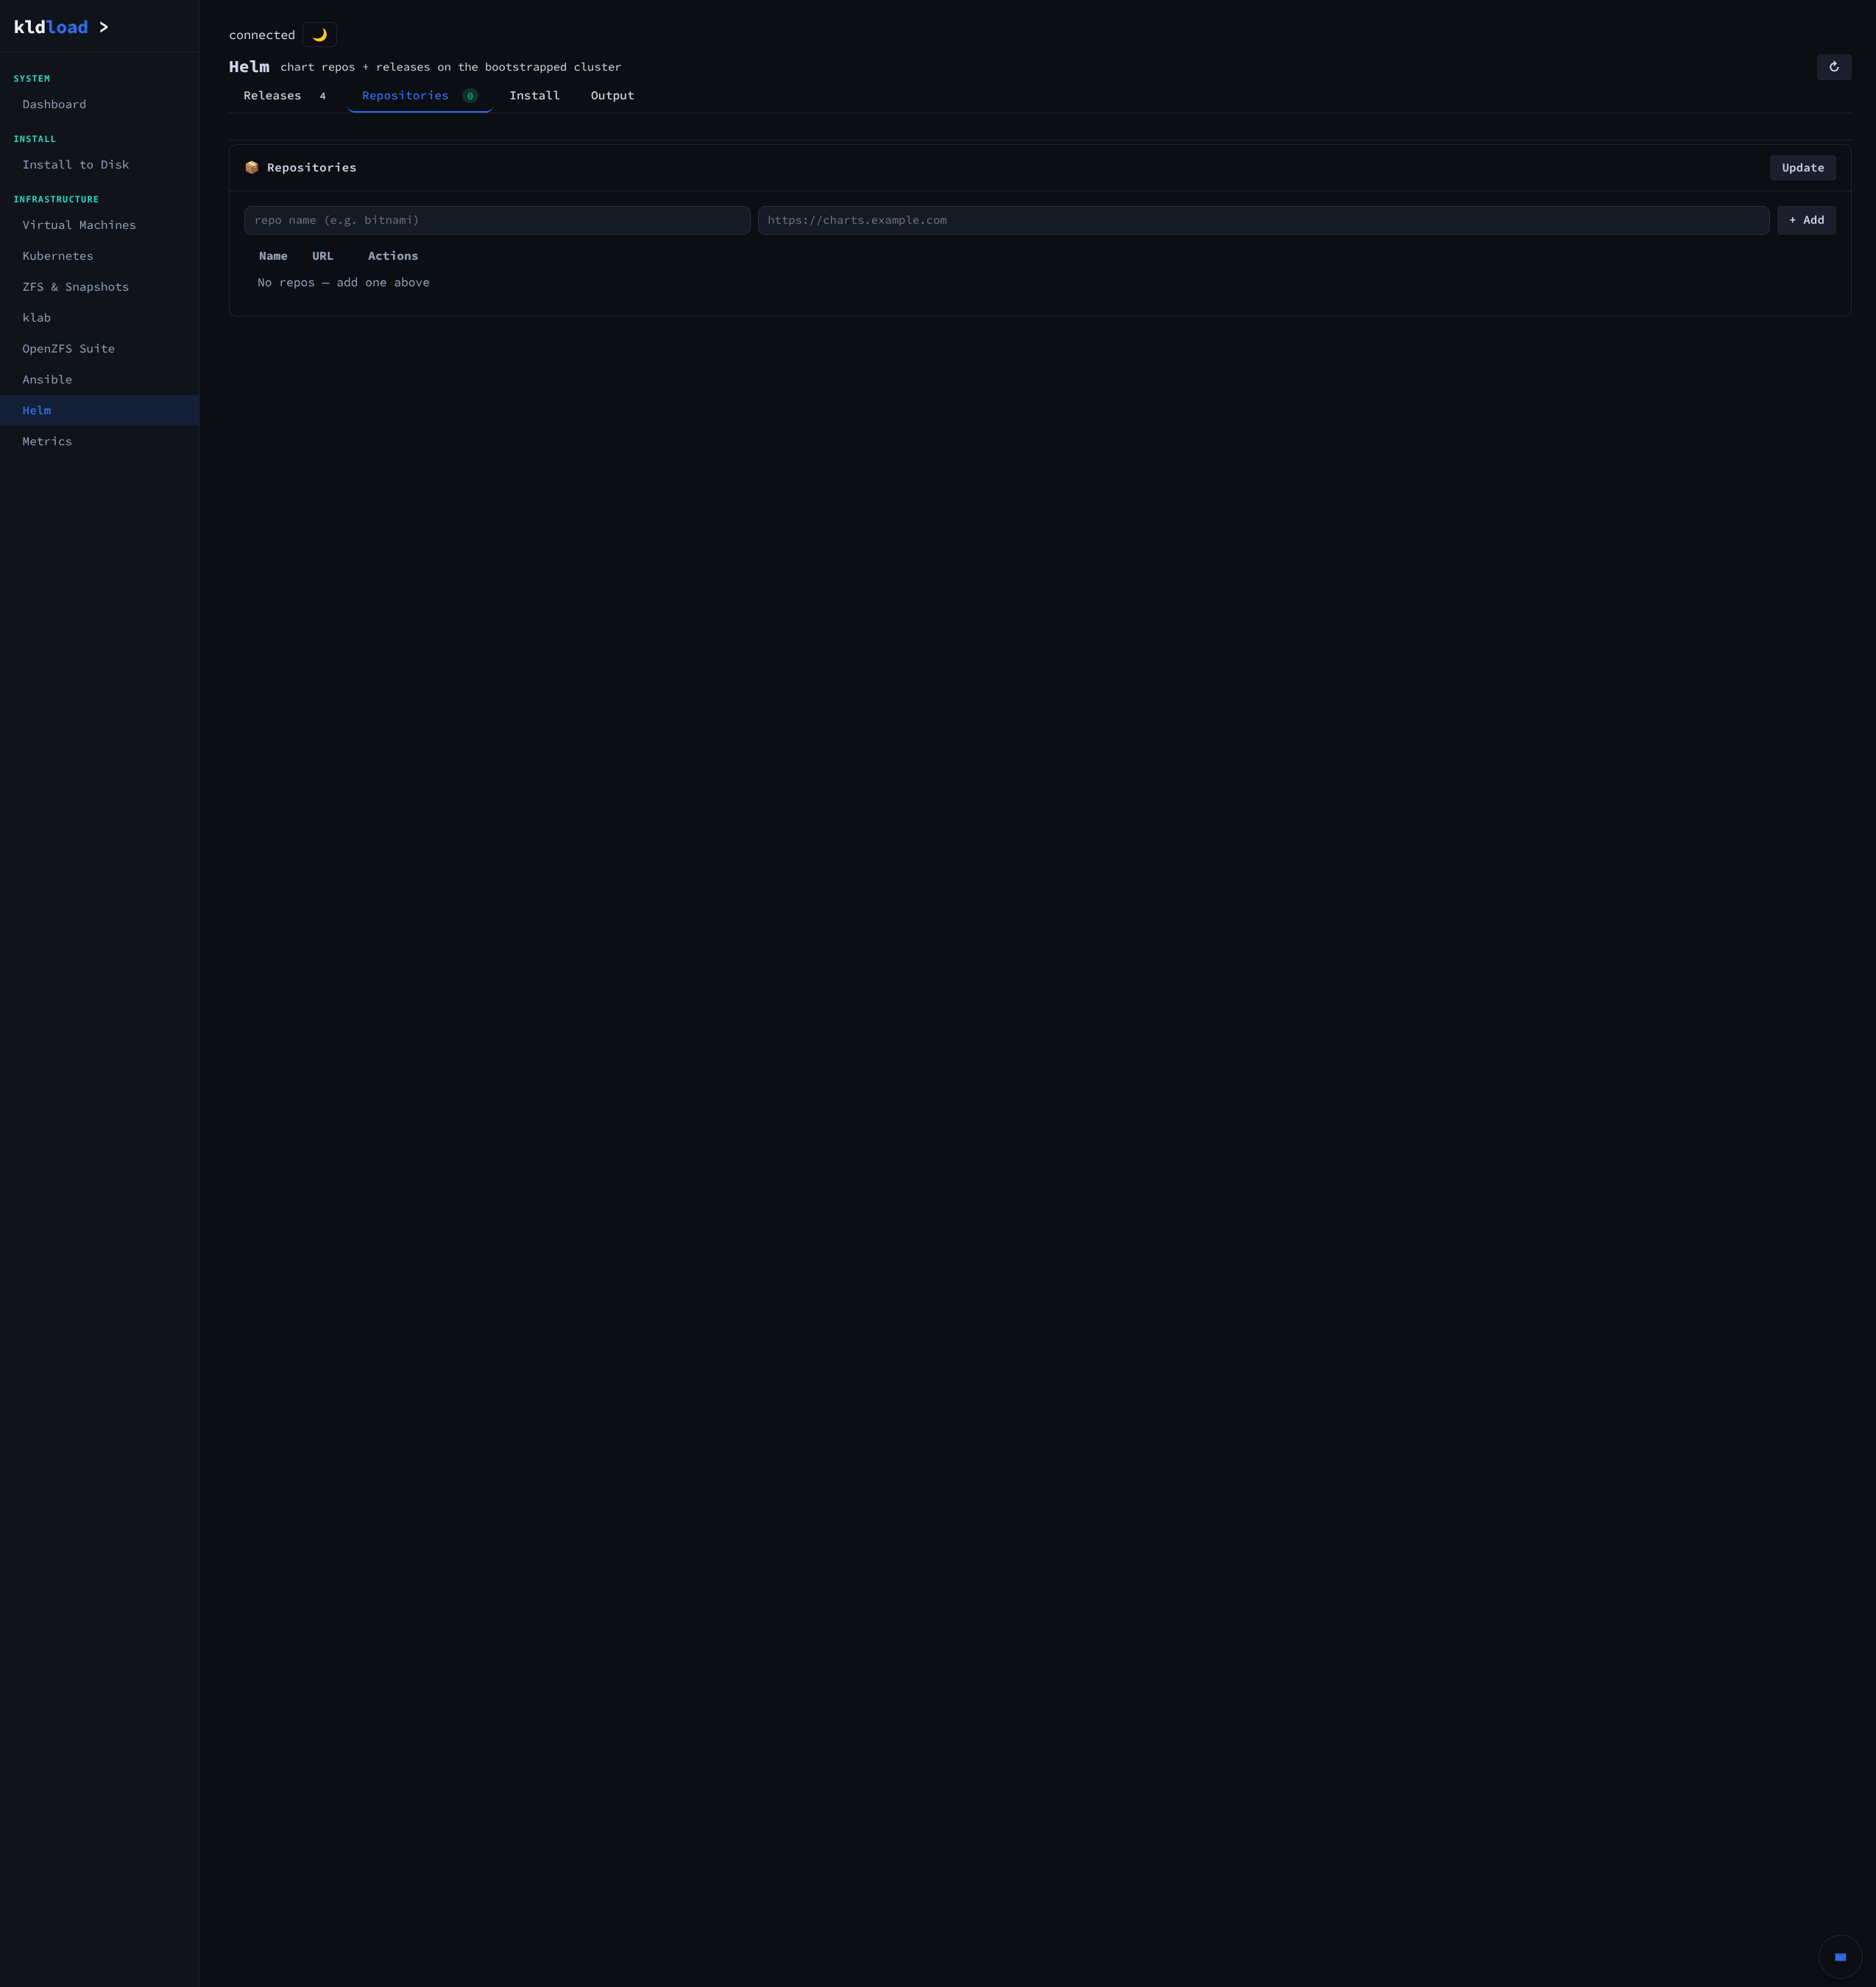
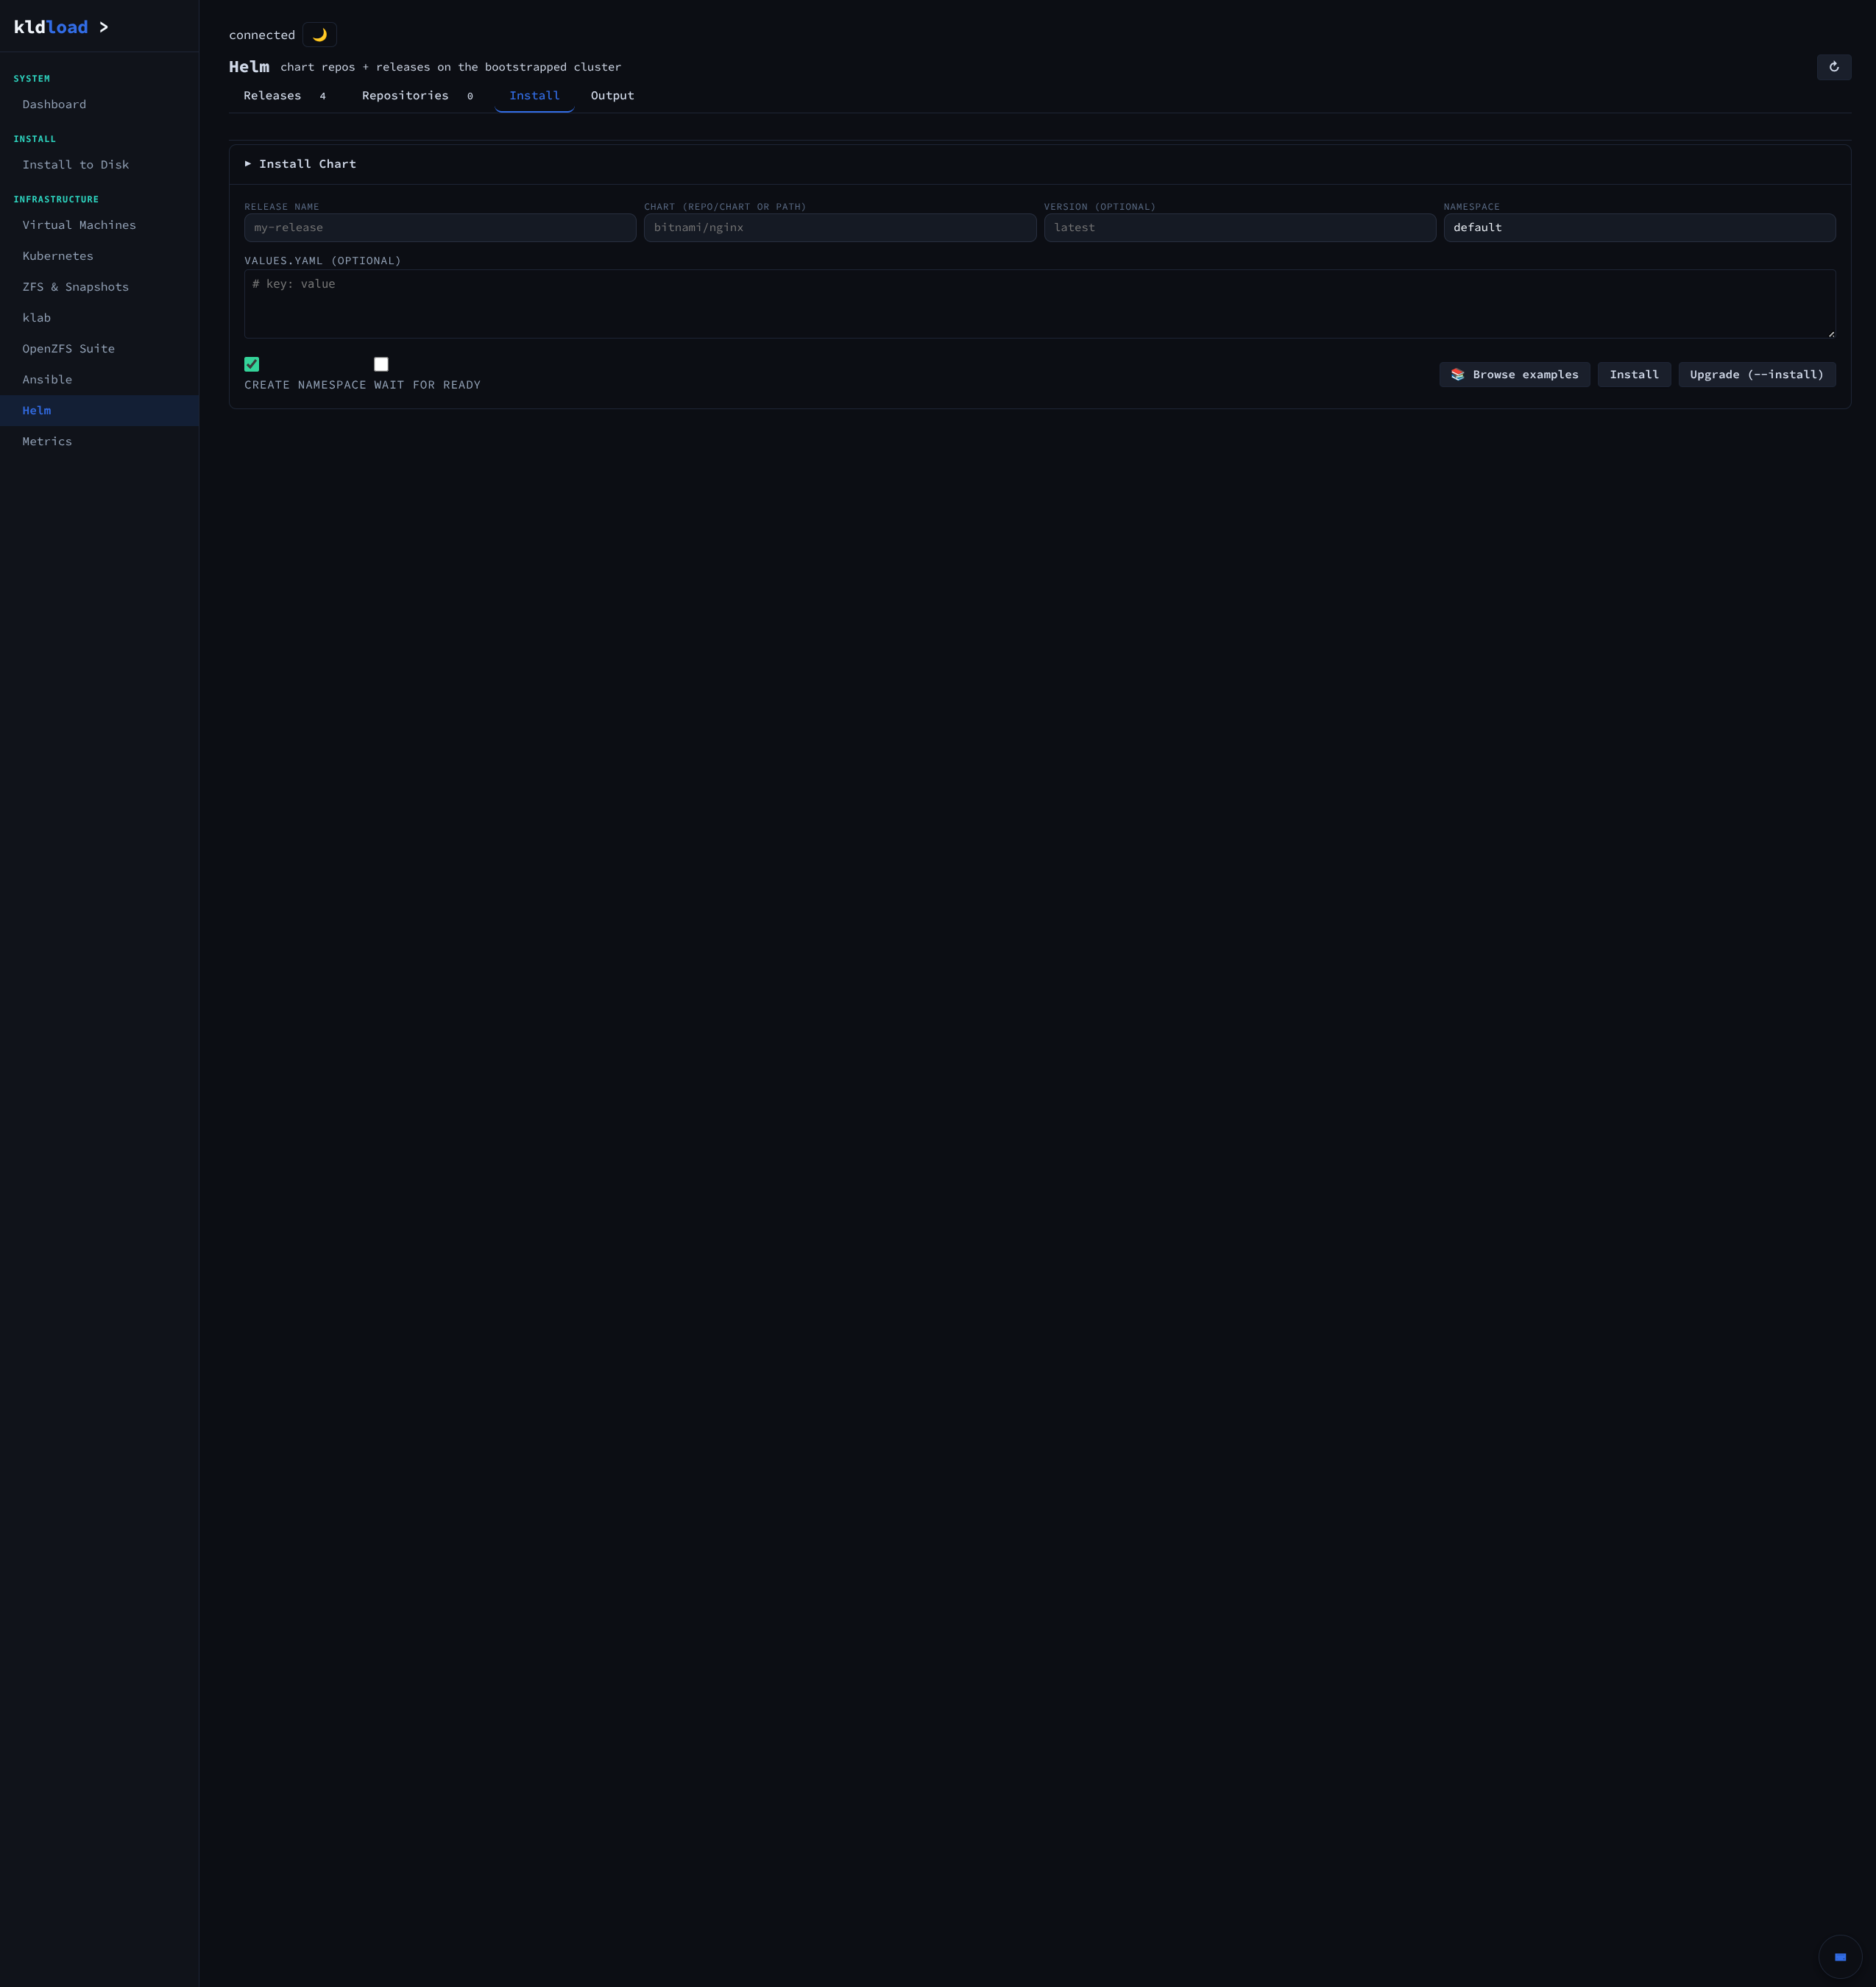
Releases (4 live: argocd, cilium, metallb, tetragon — everything the cluster bootstrapped with), Repositories (chart repo browser, sync, add), Install (the chart install form for the moment you do need to type things yourself).
Metrics — xray vision for your infrastructure
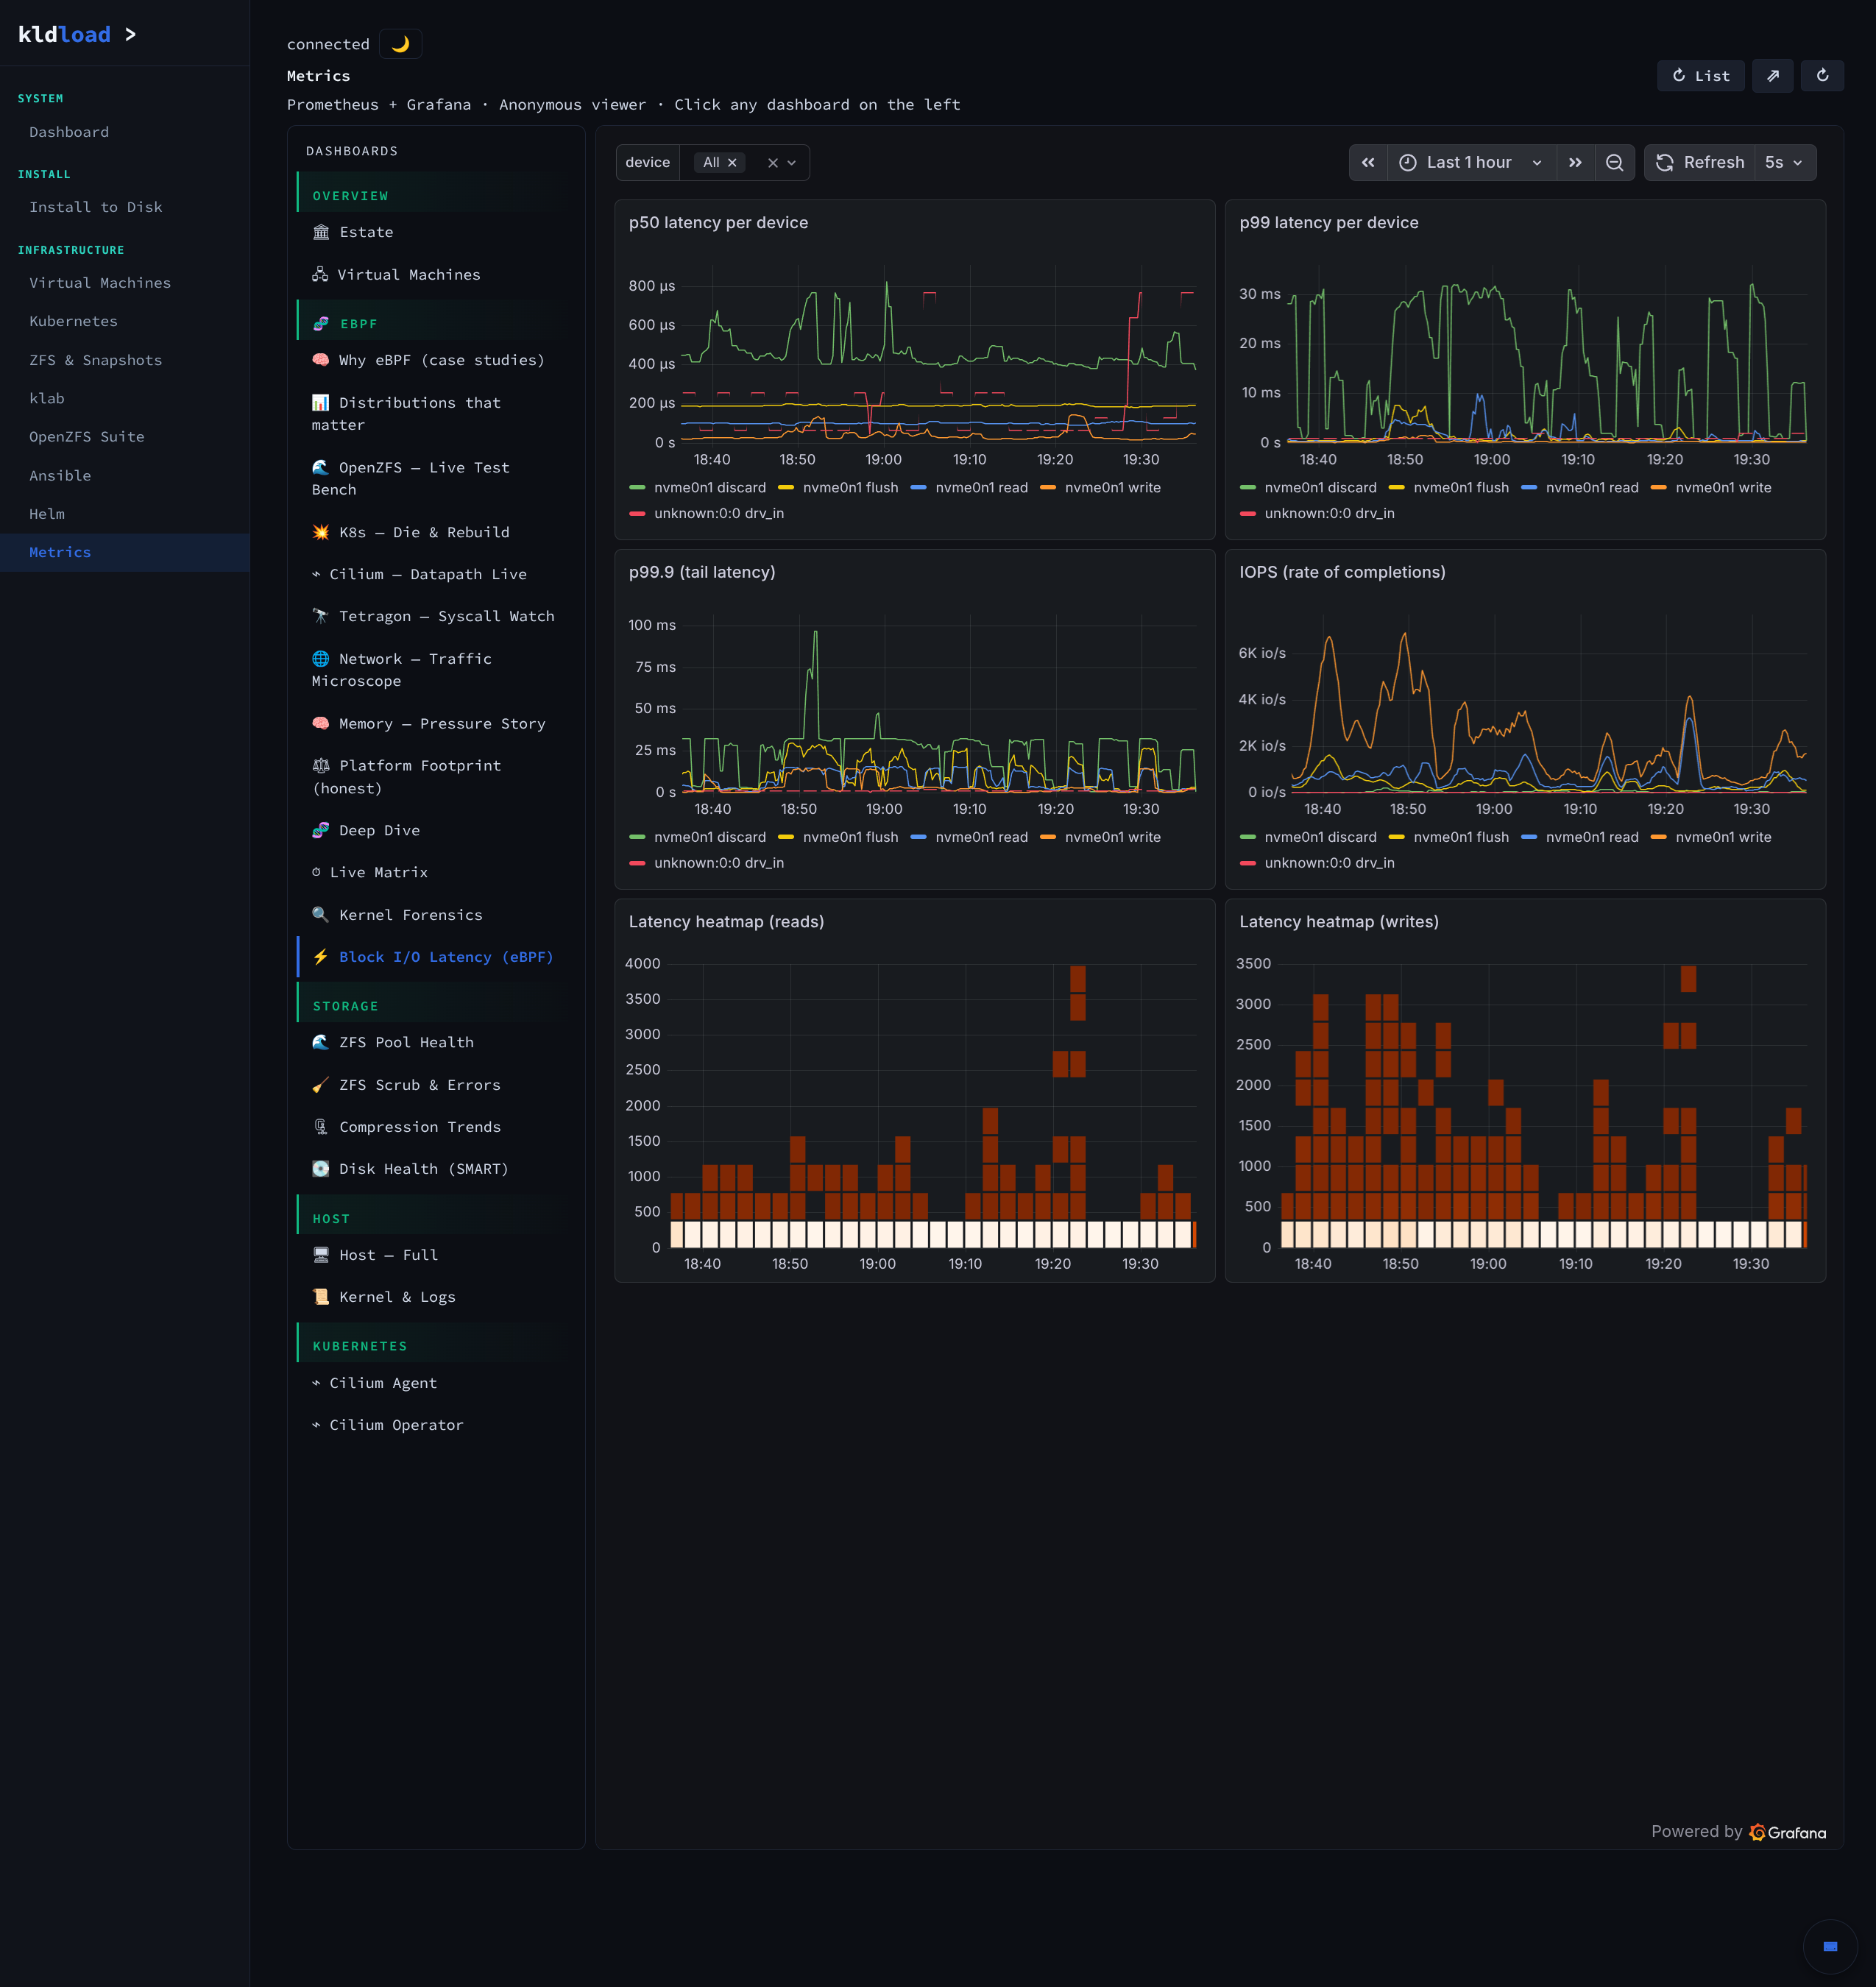
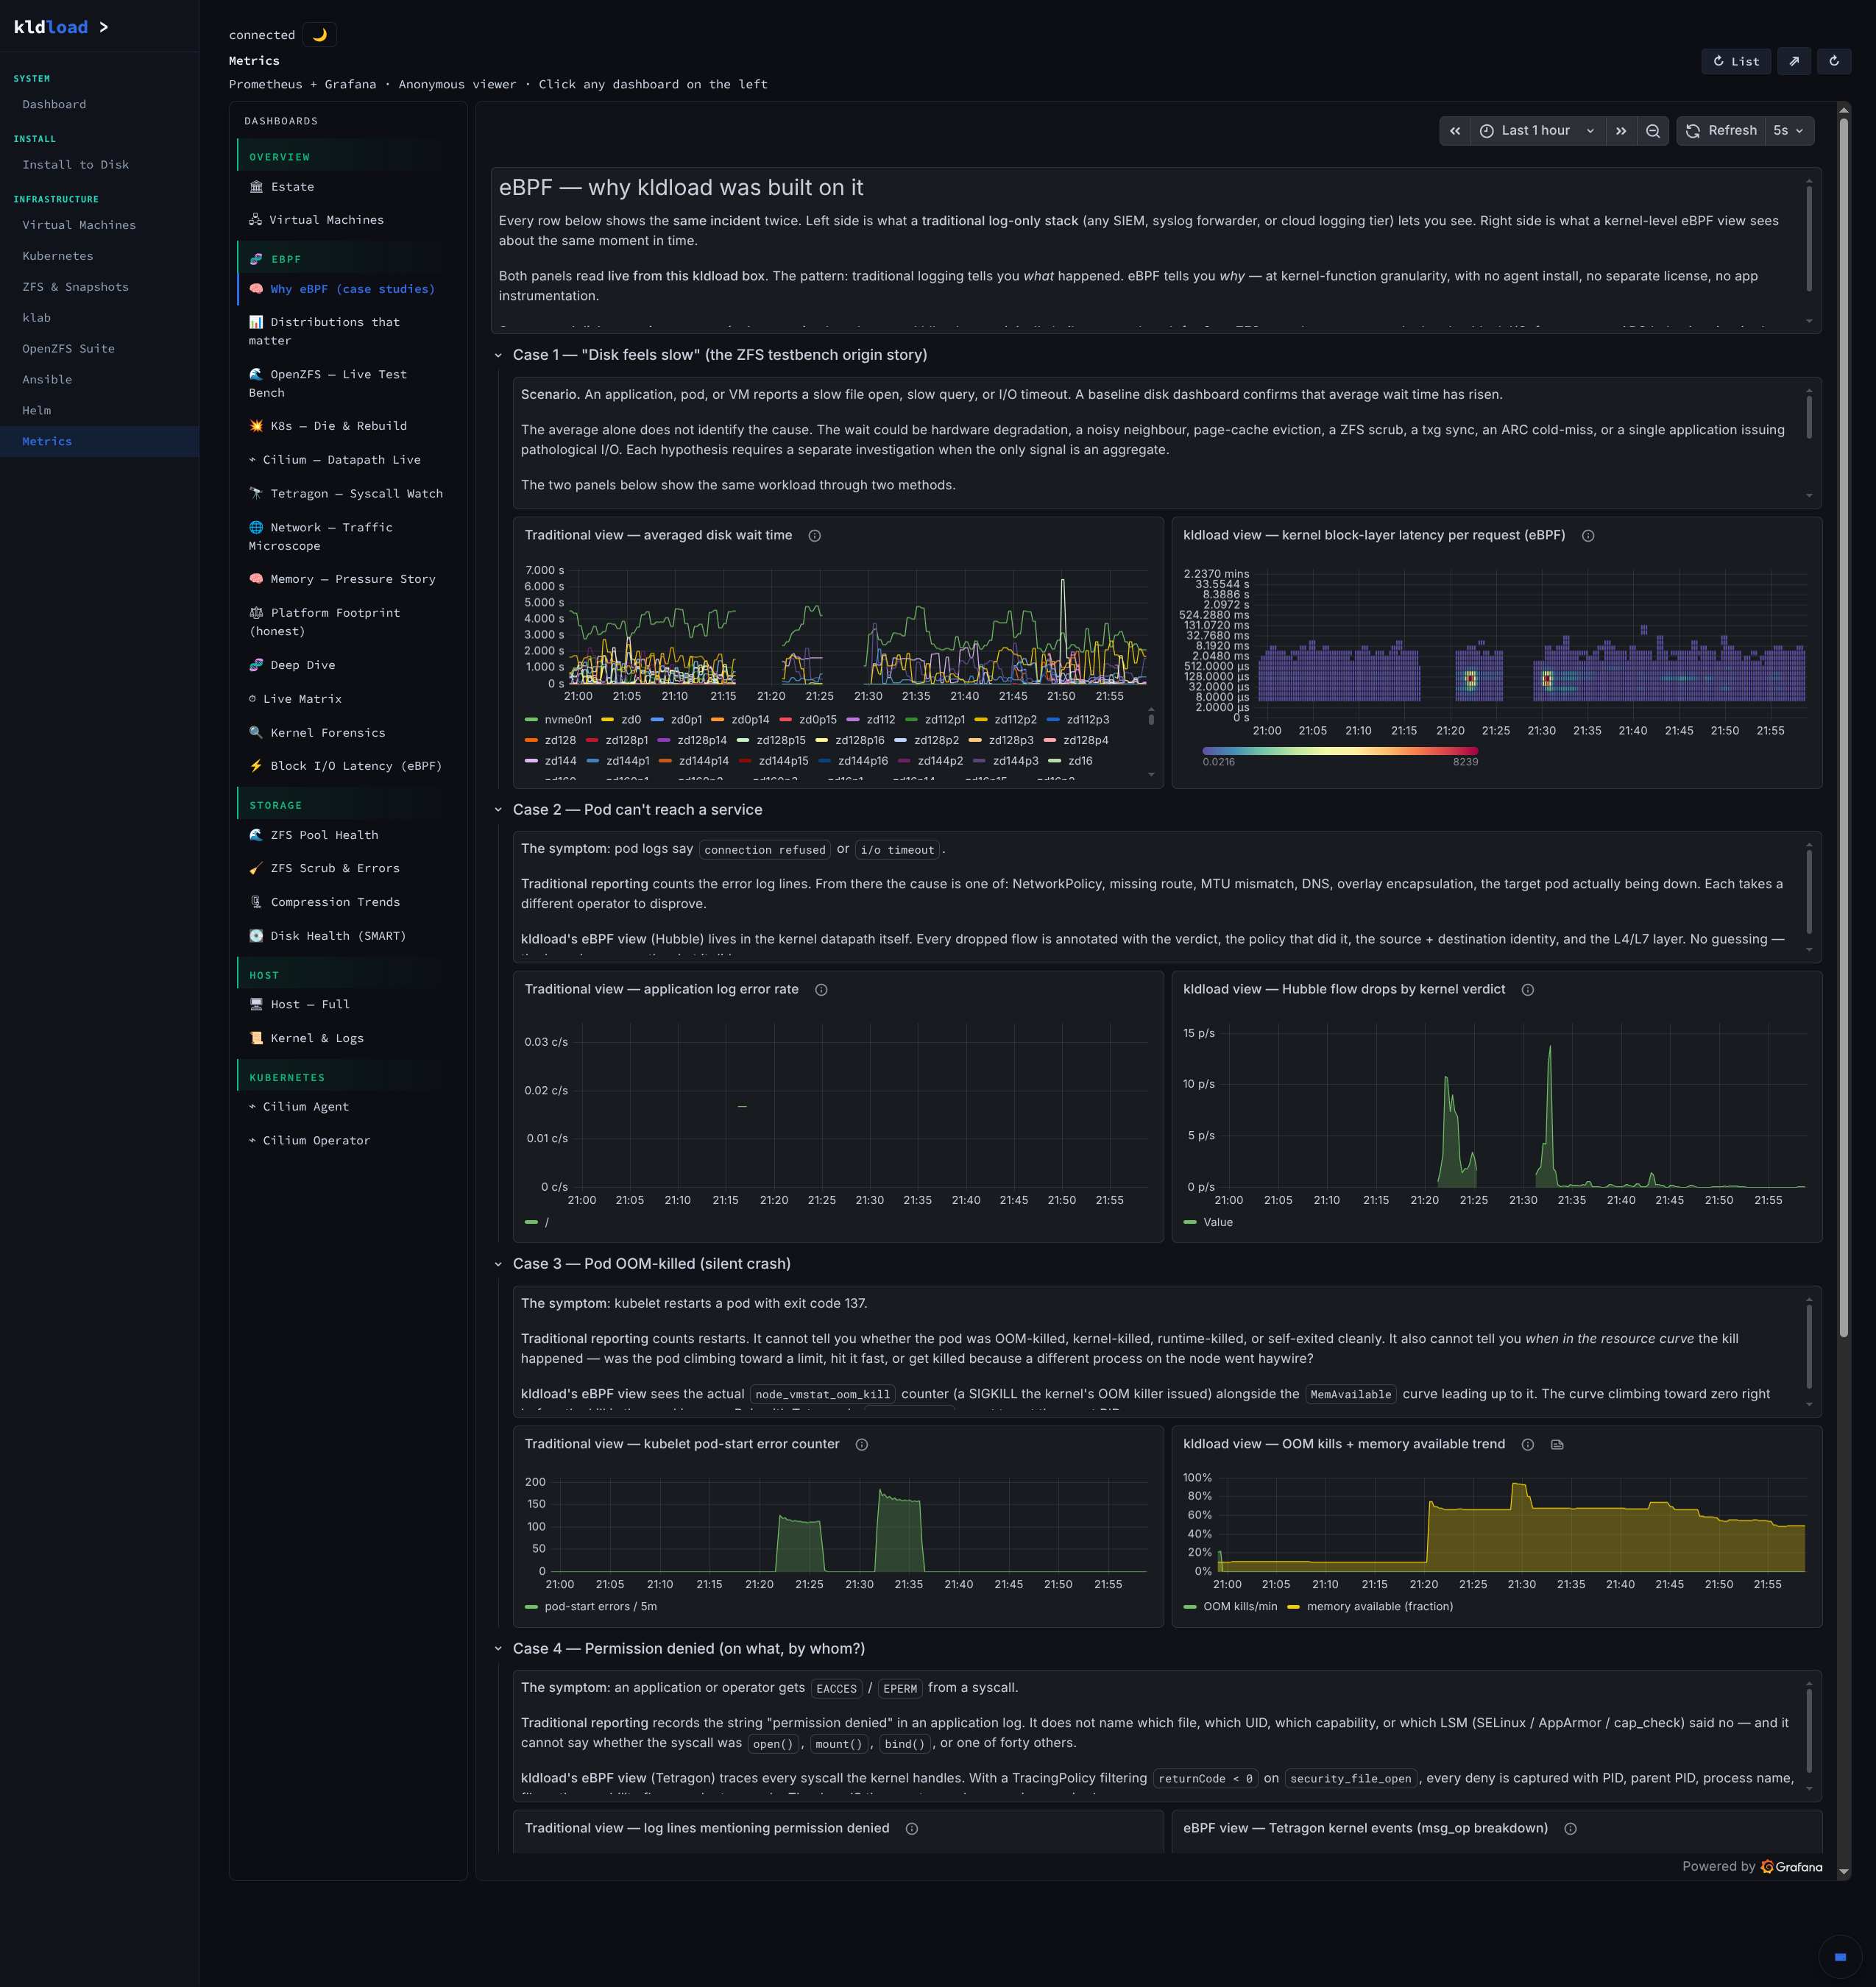
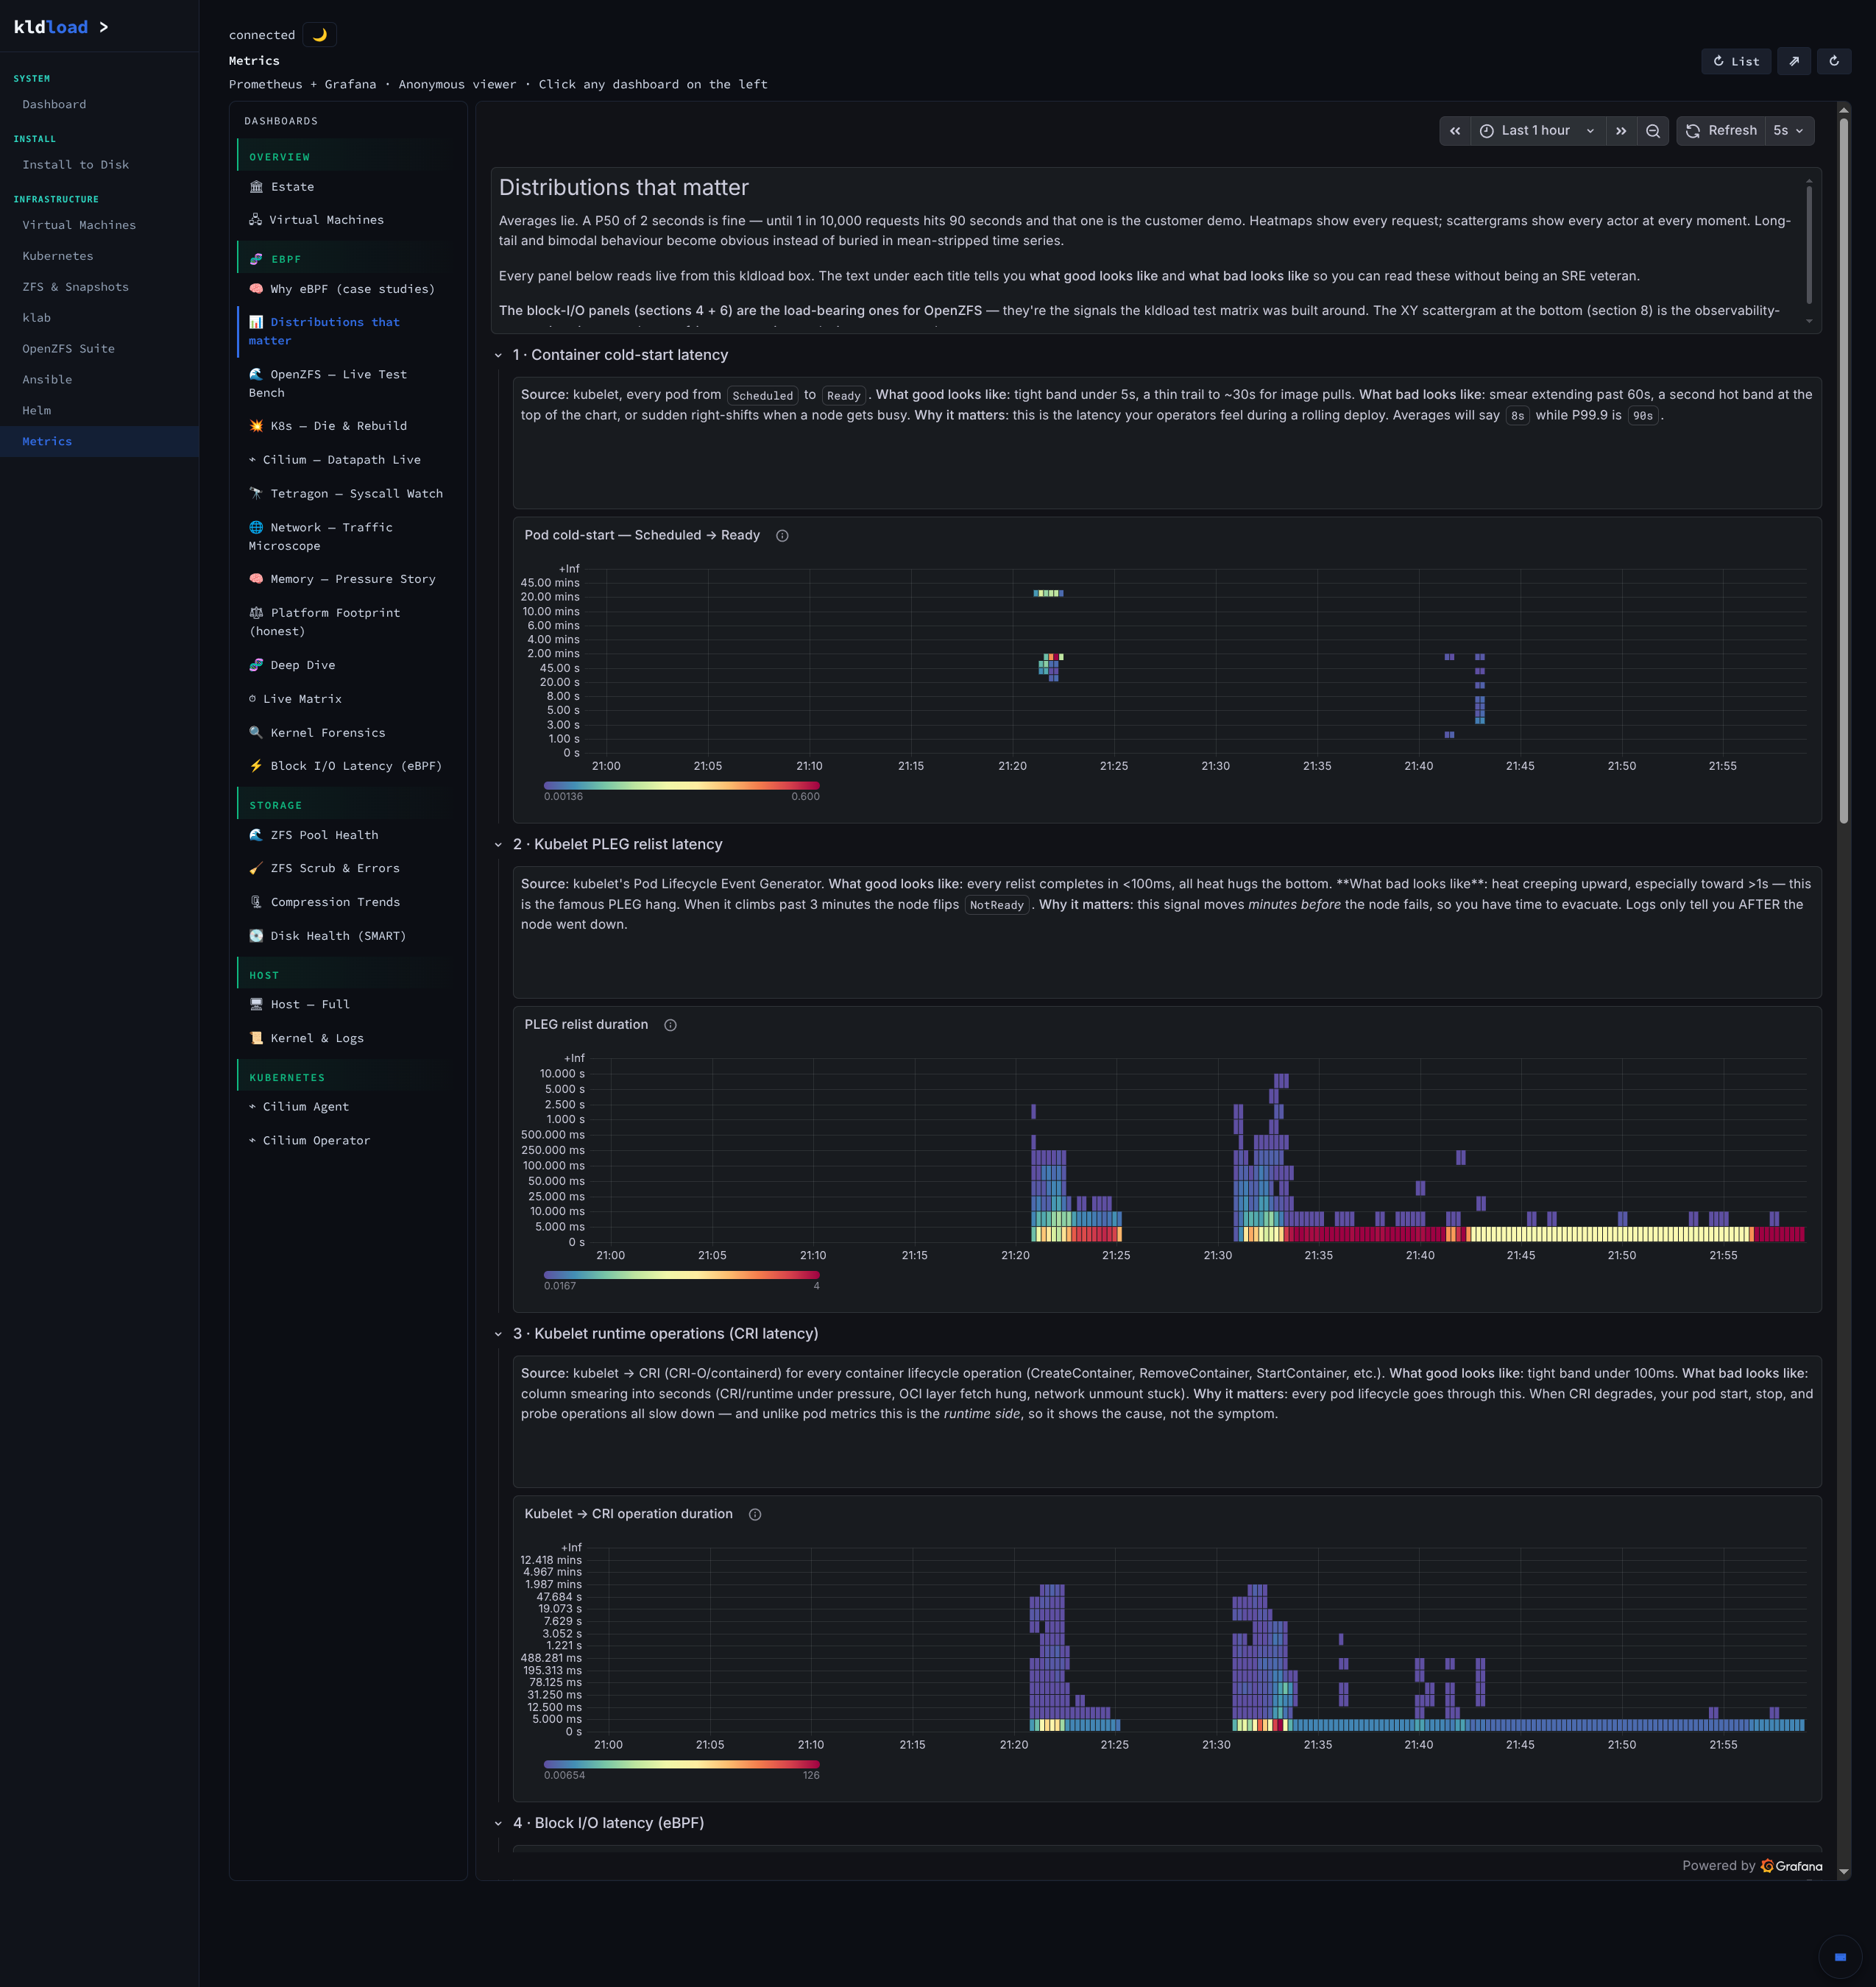
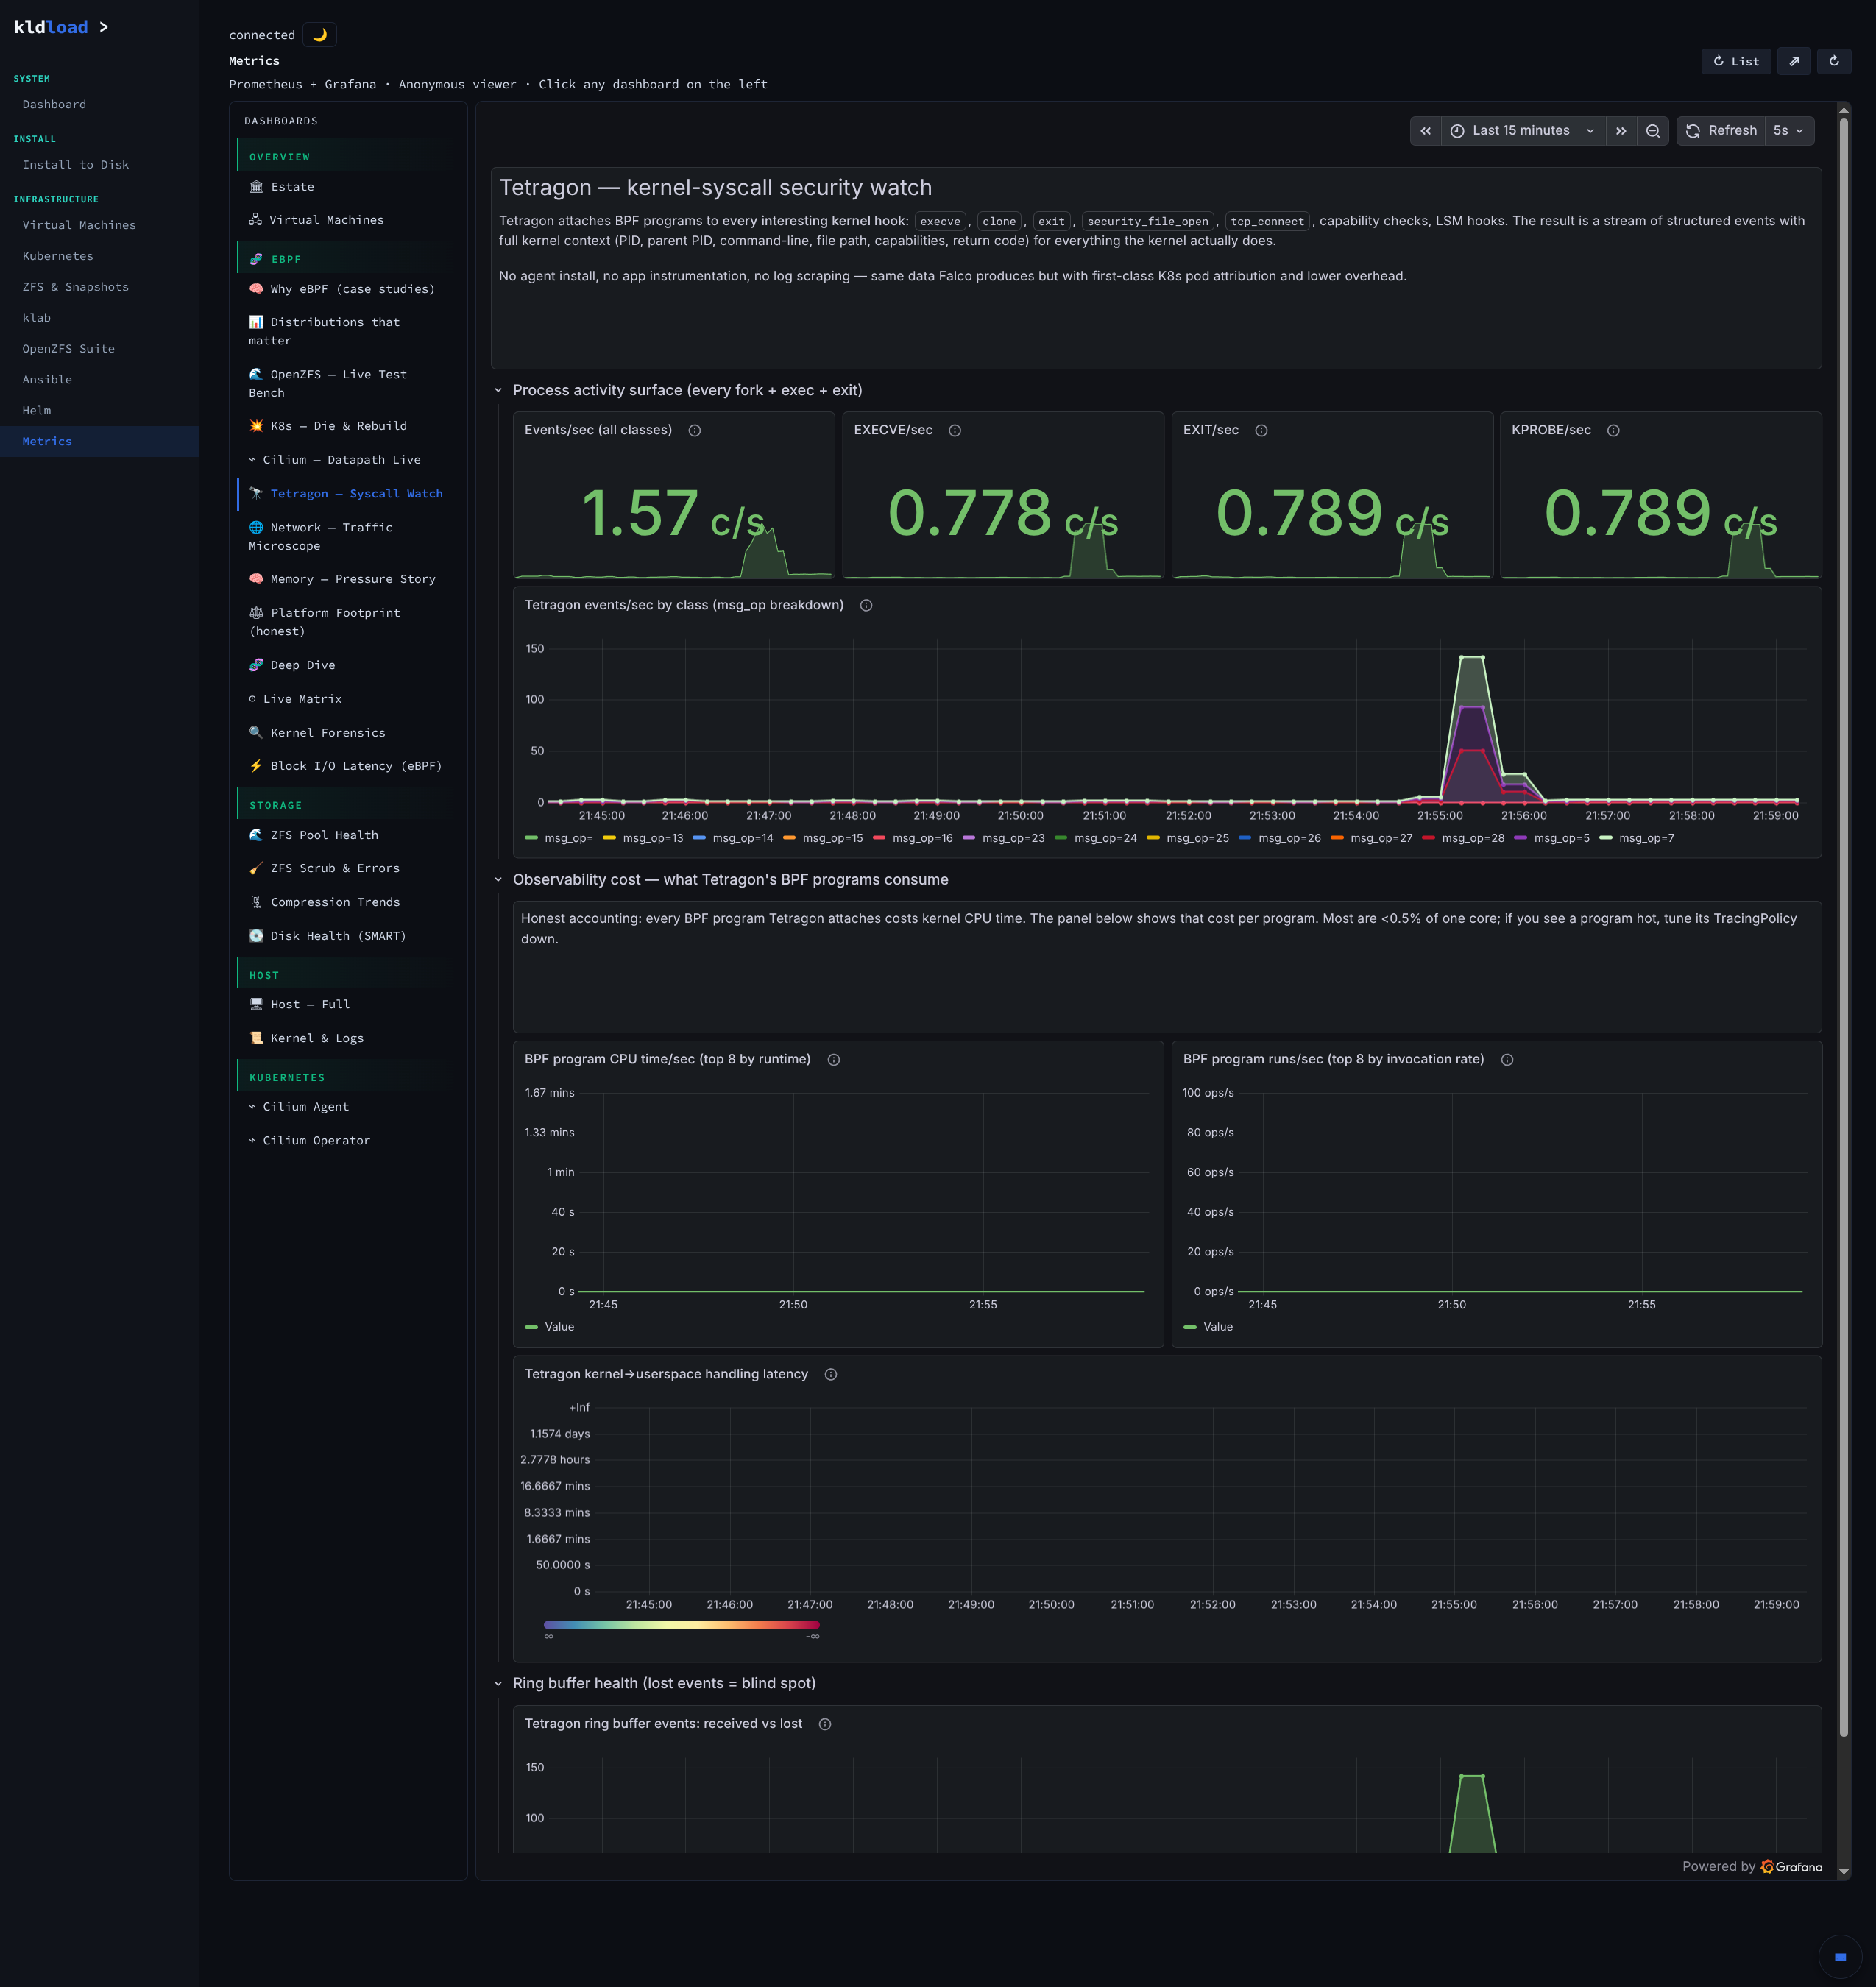
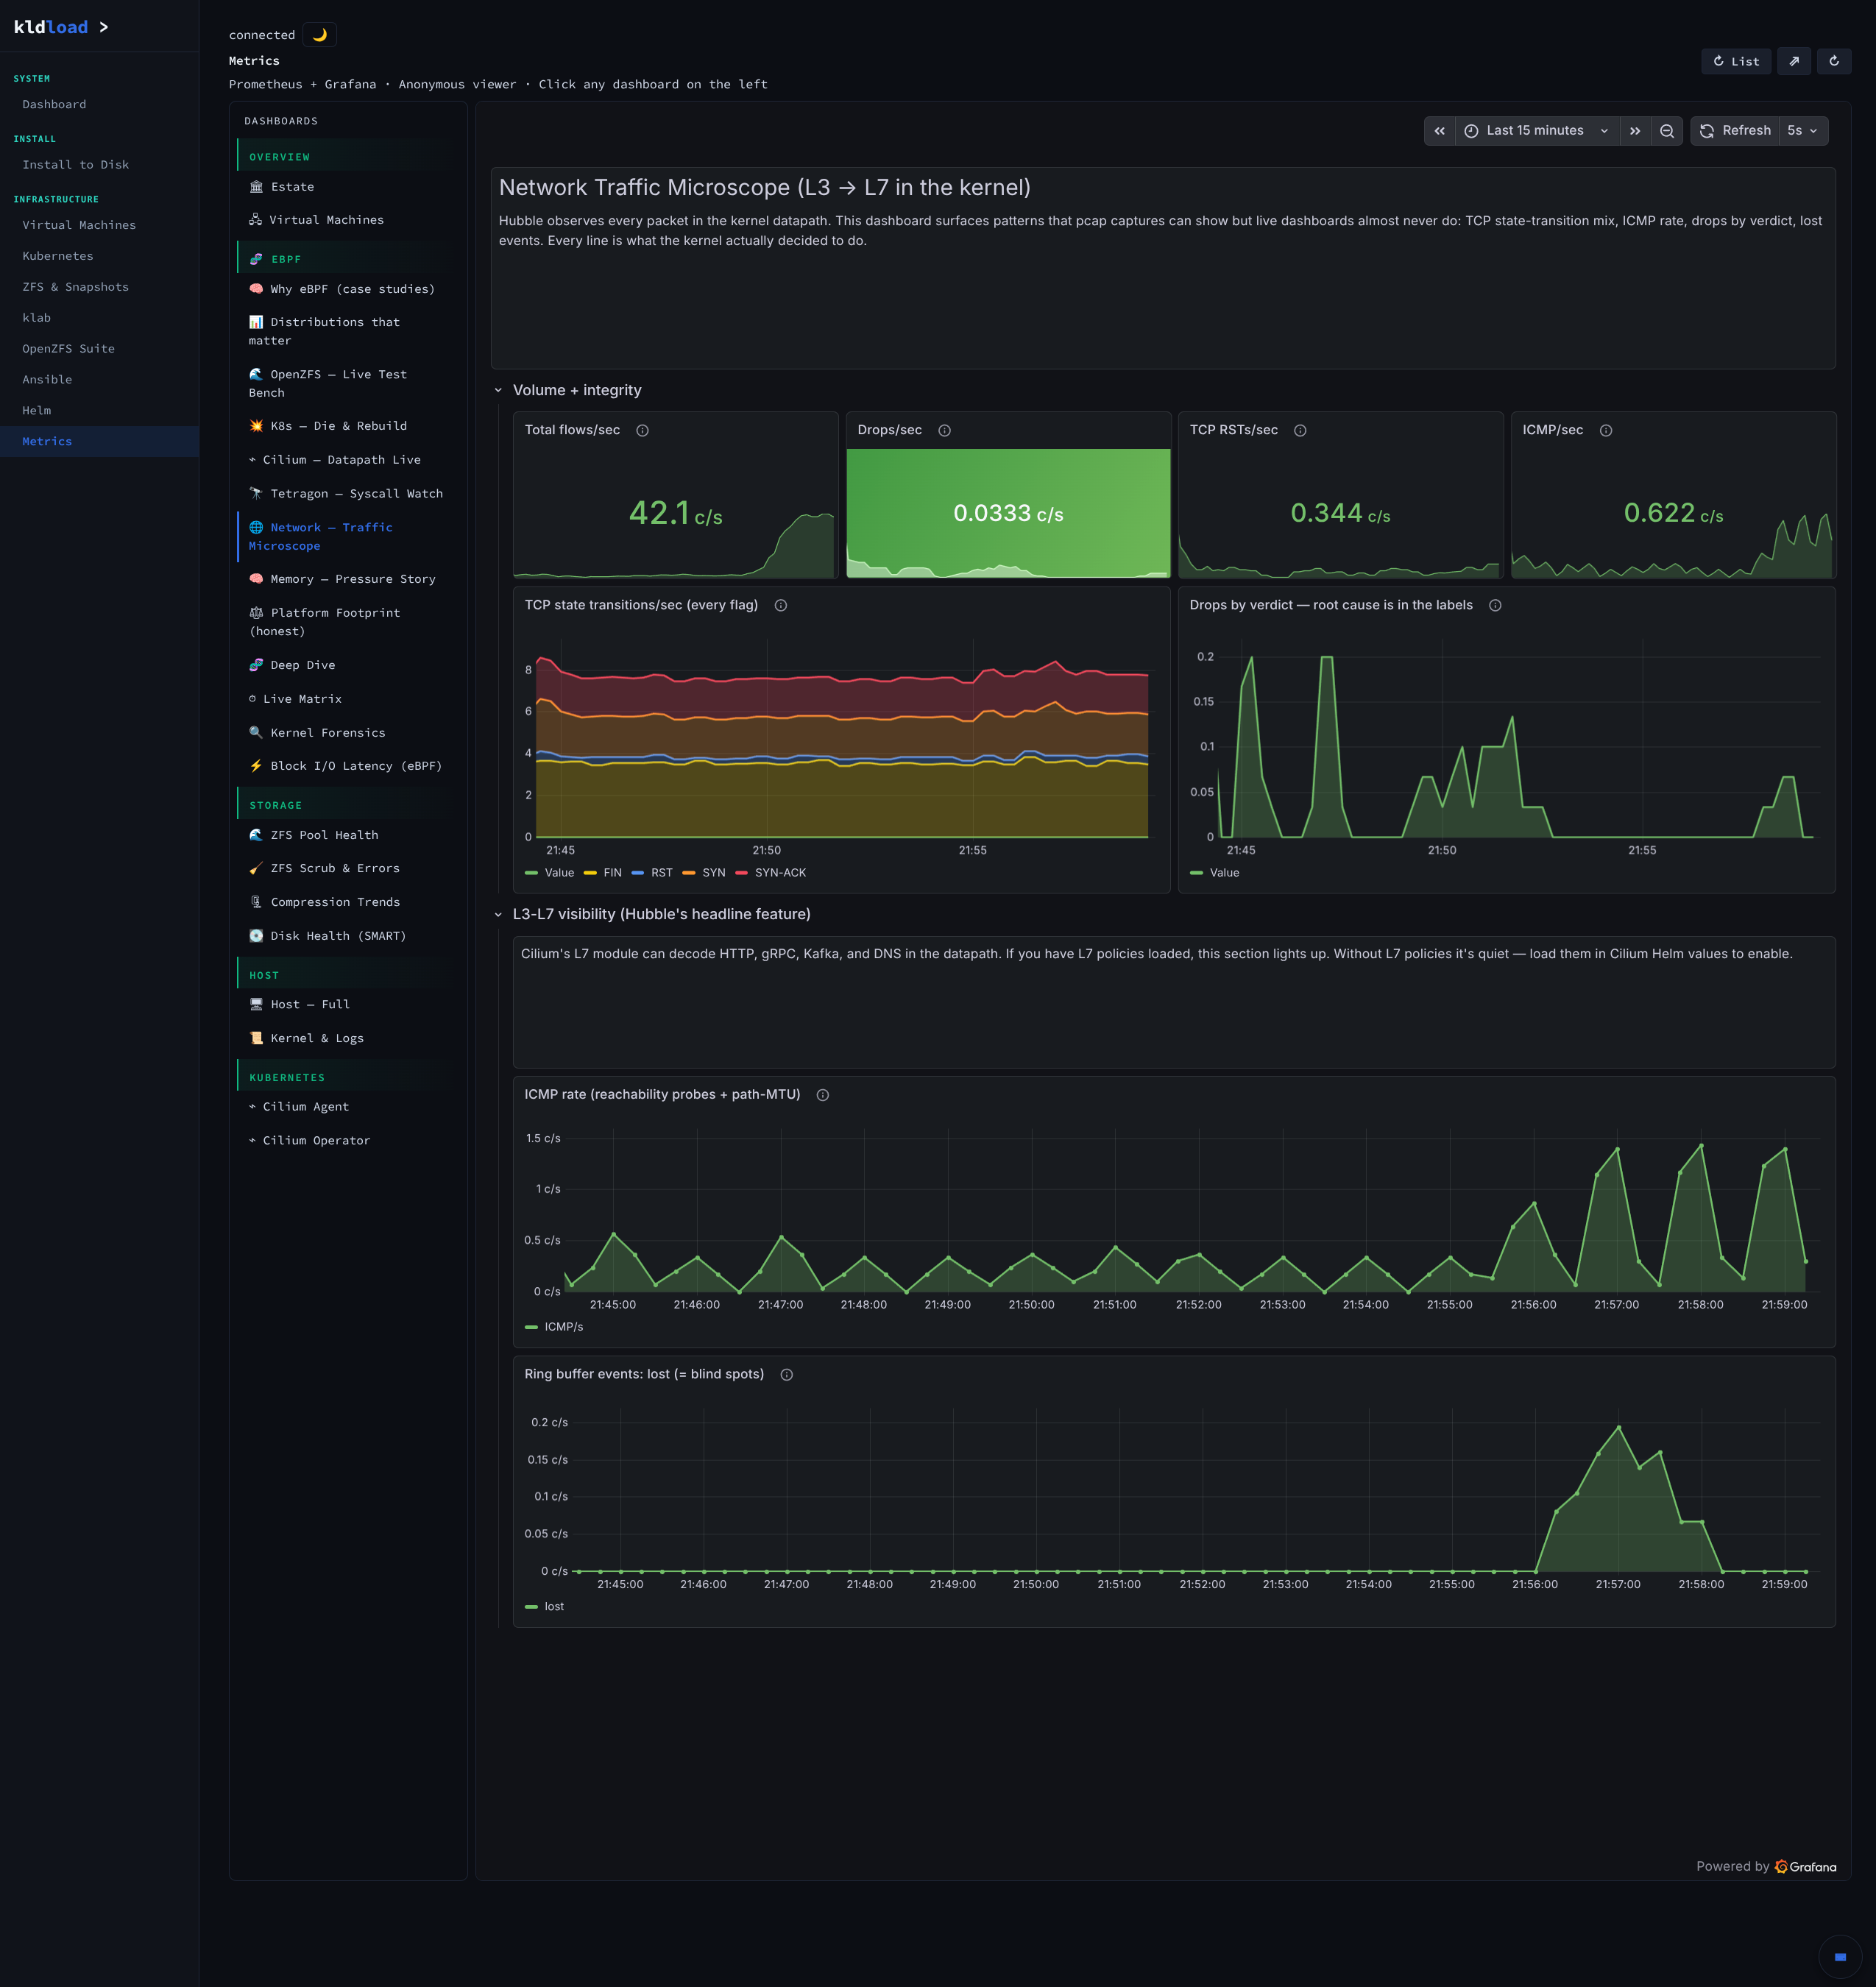
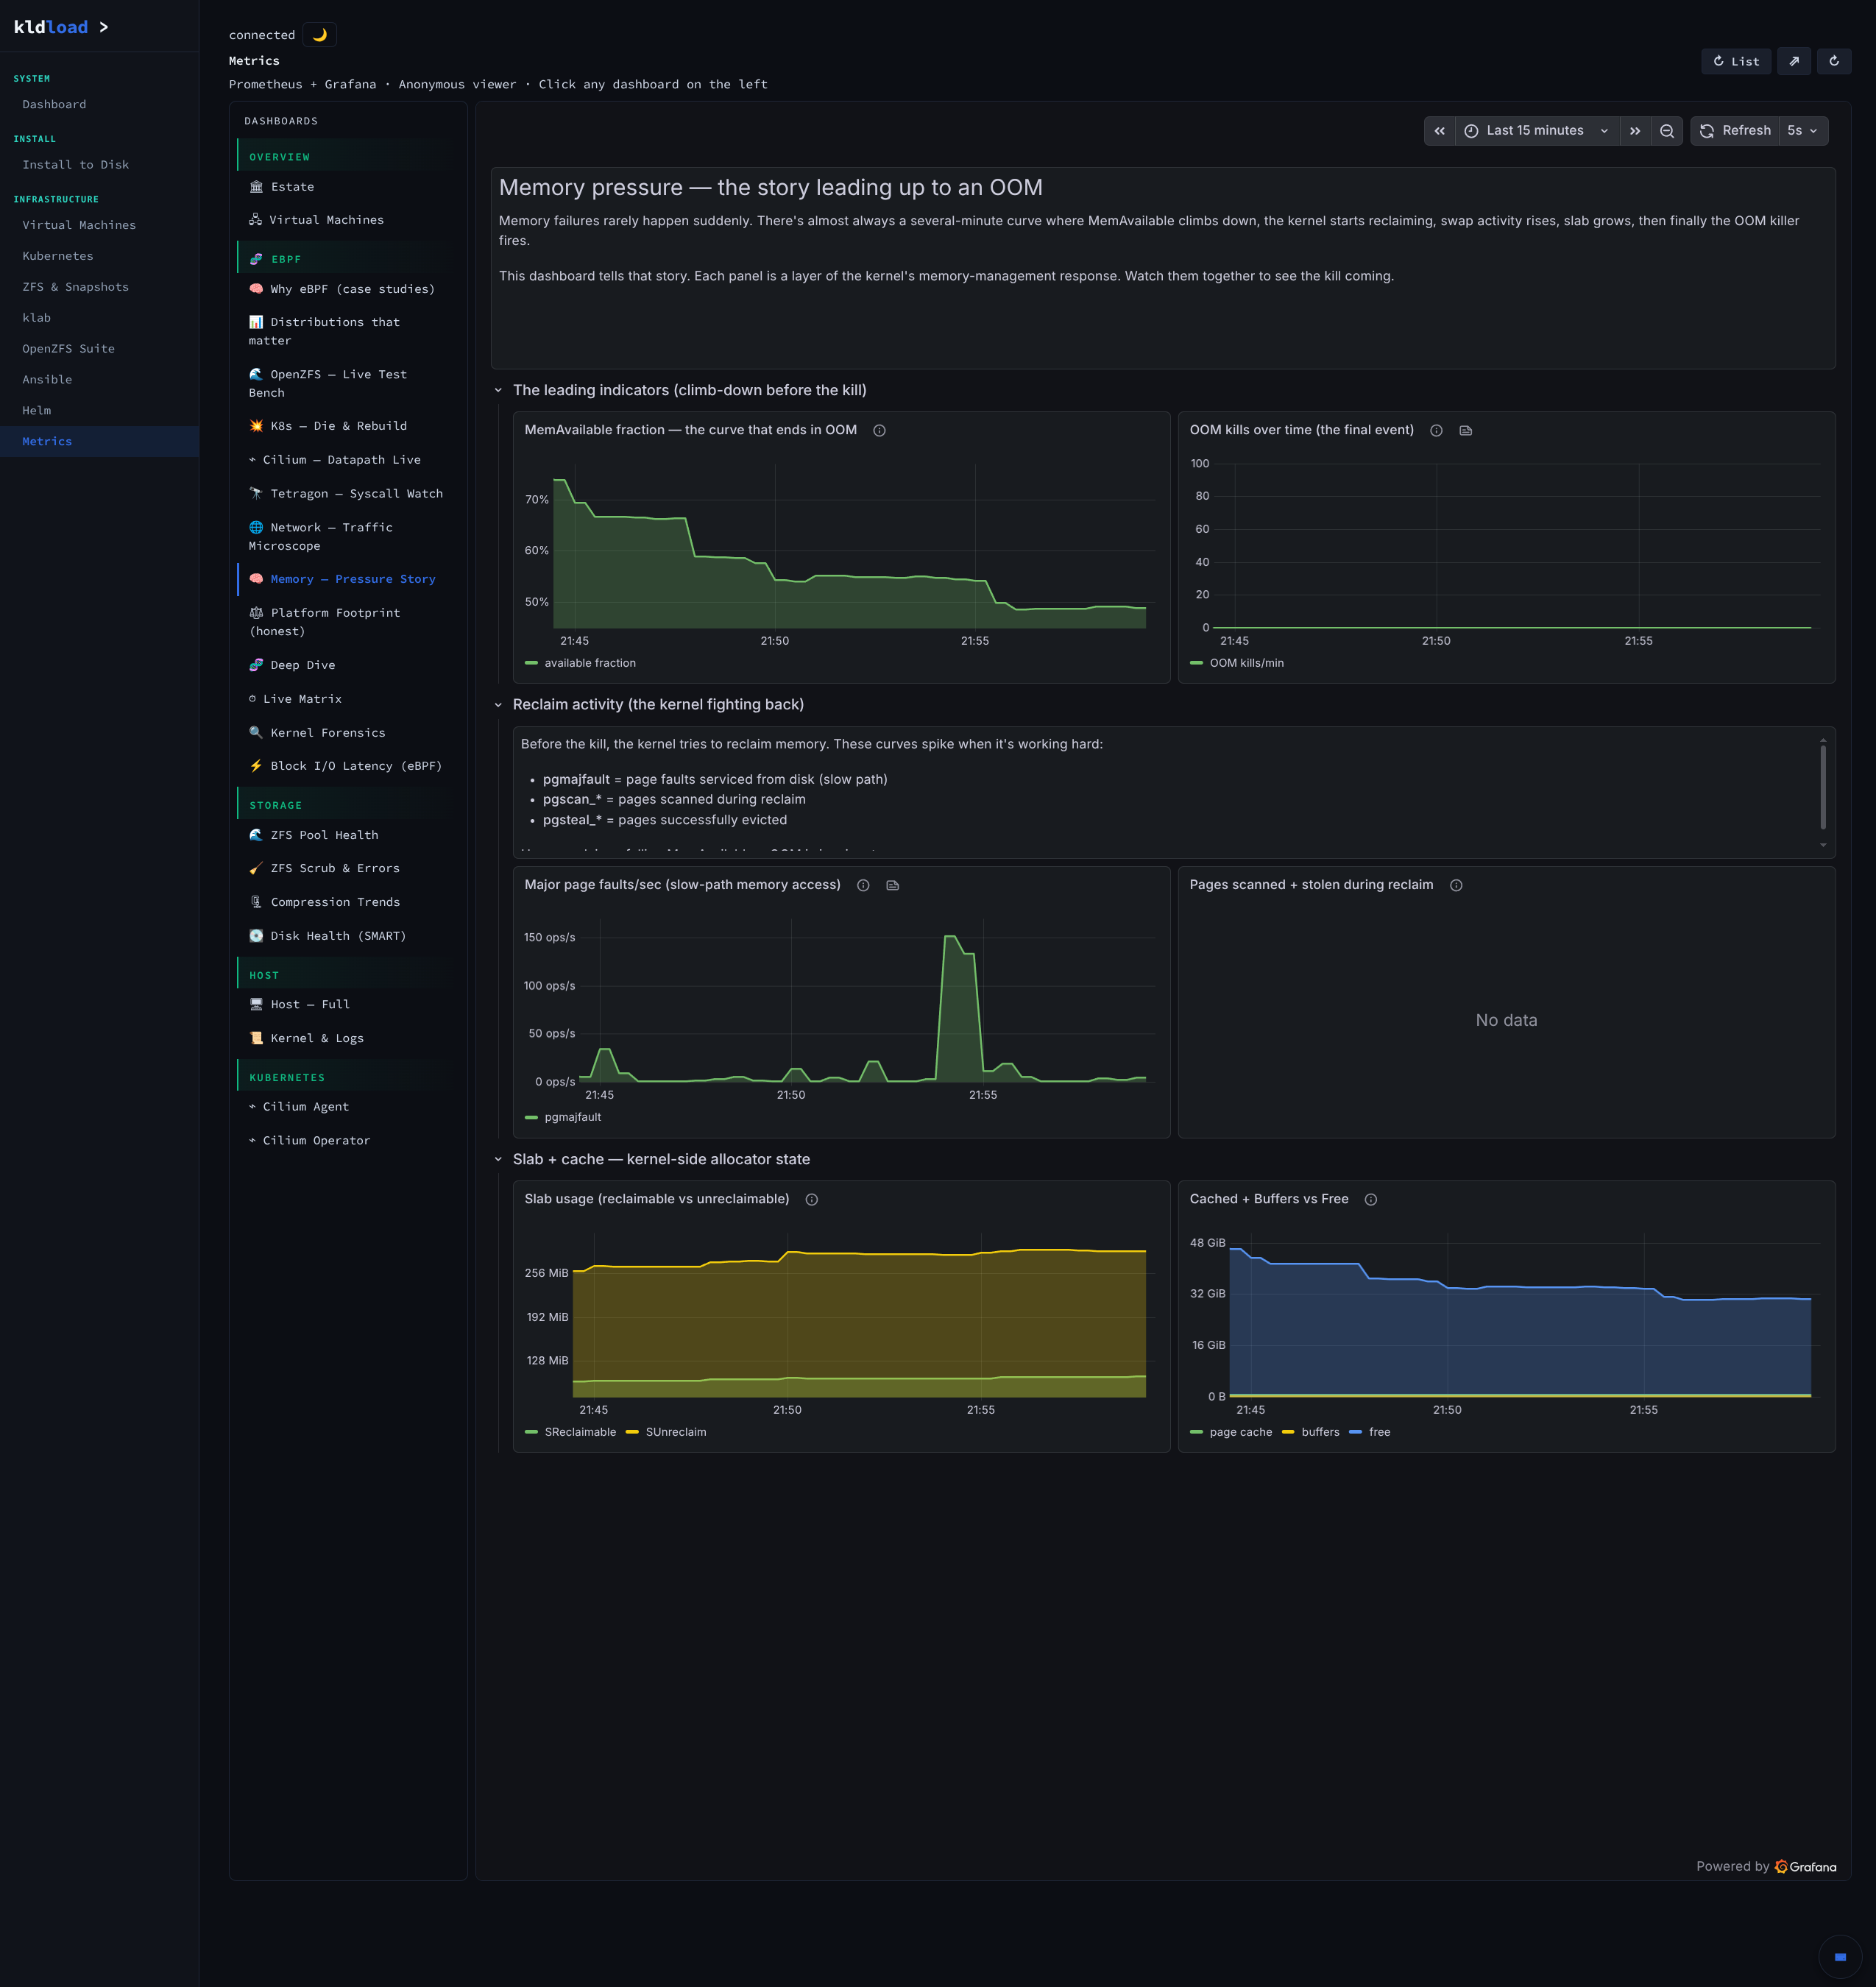
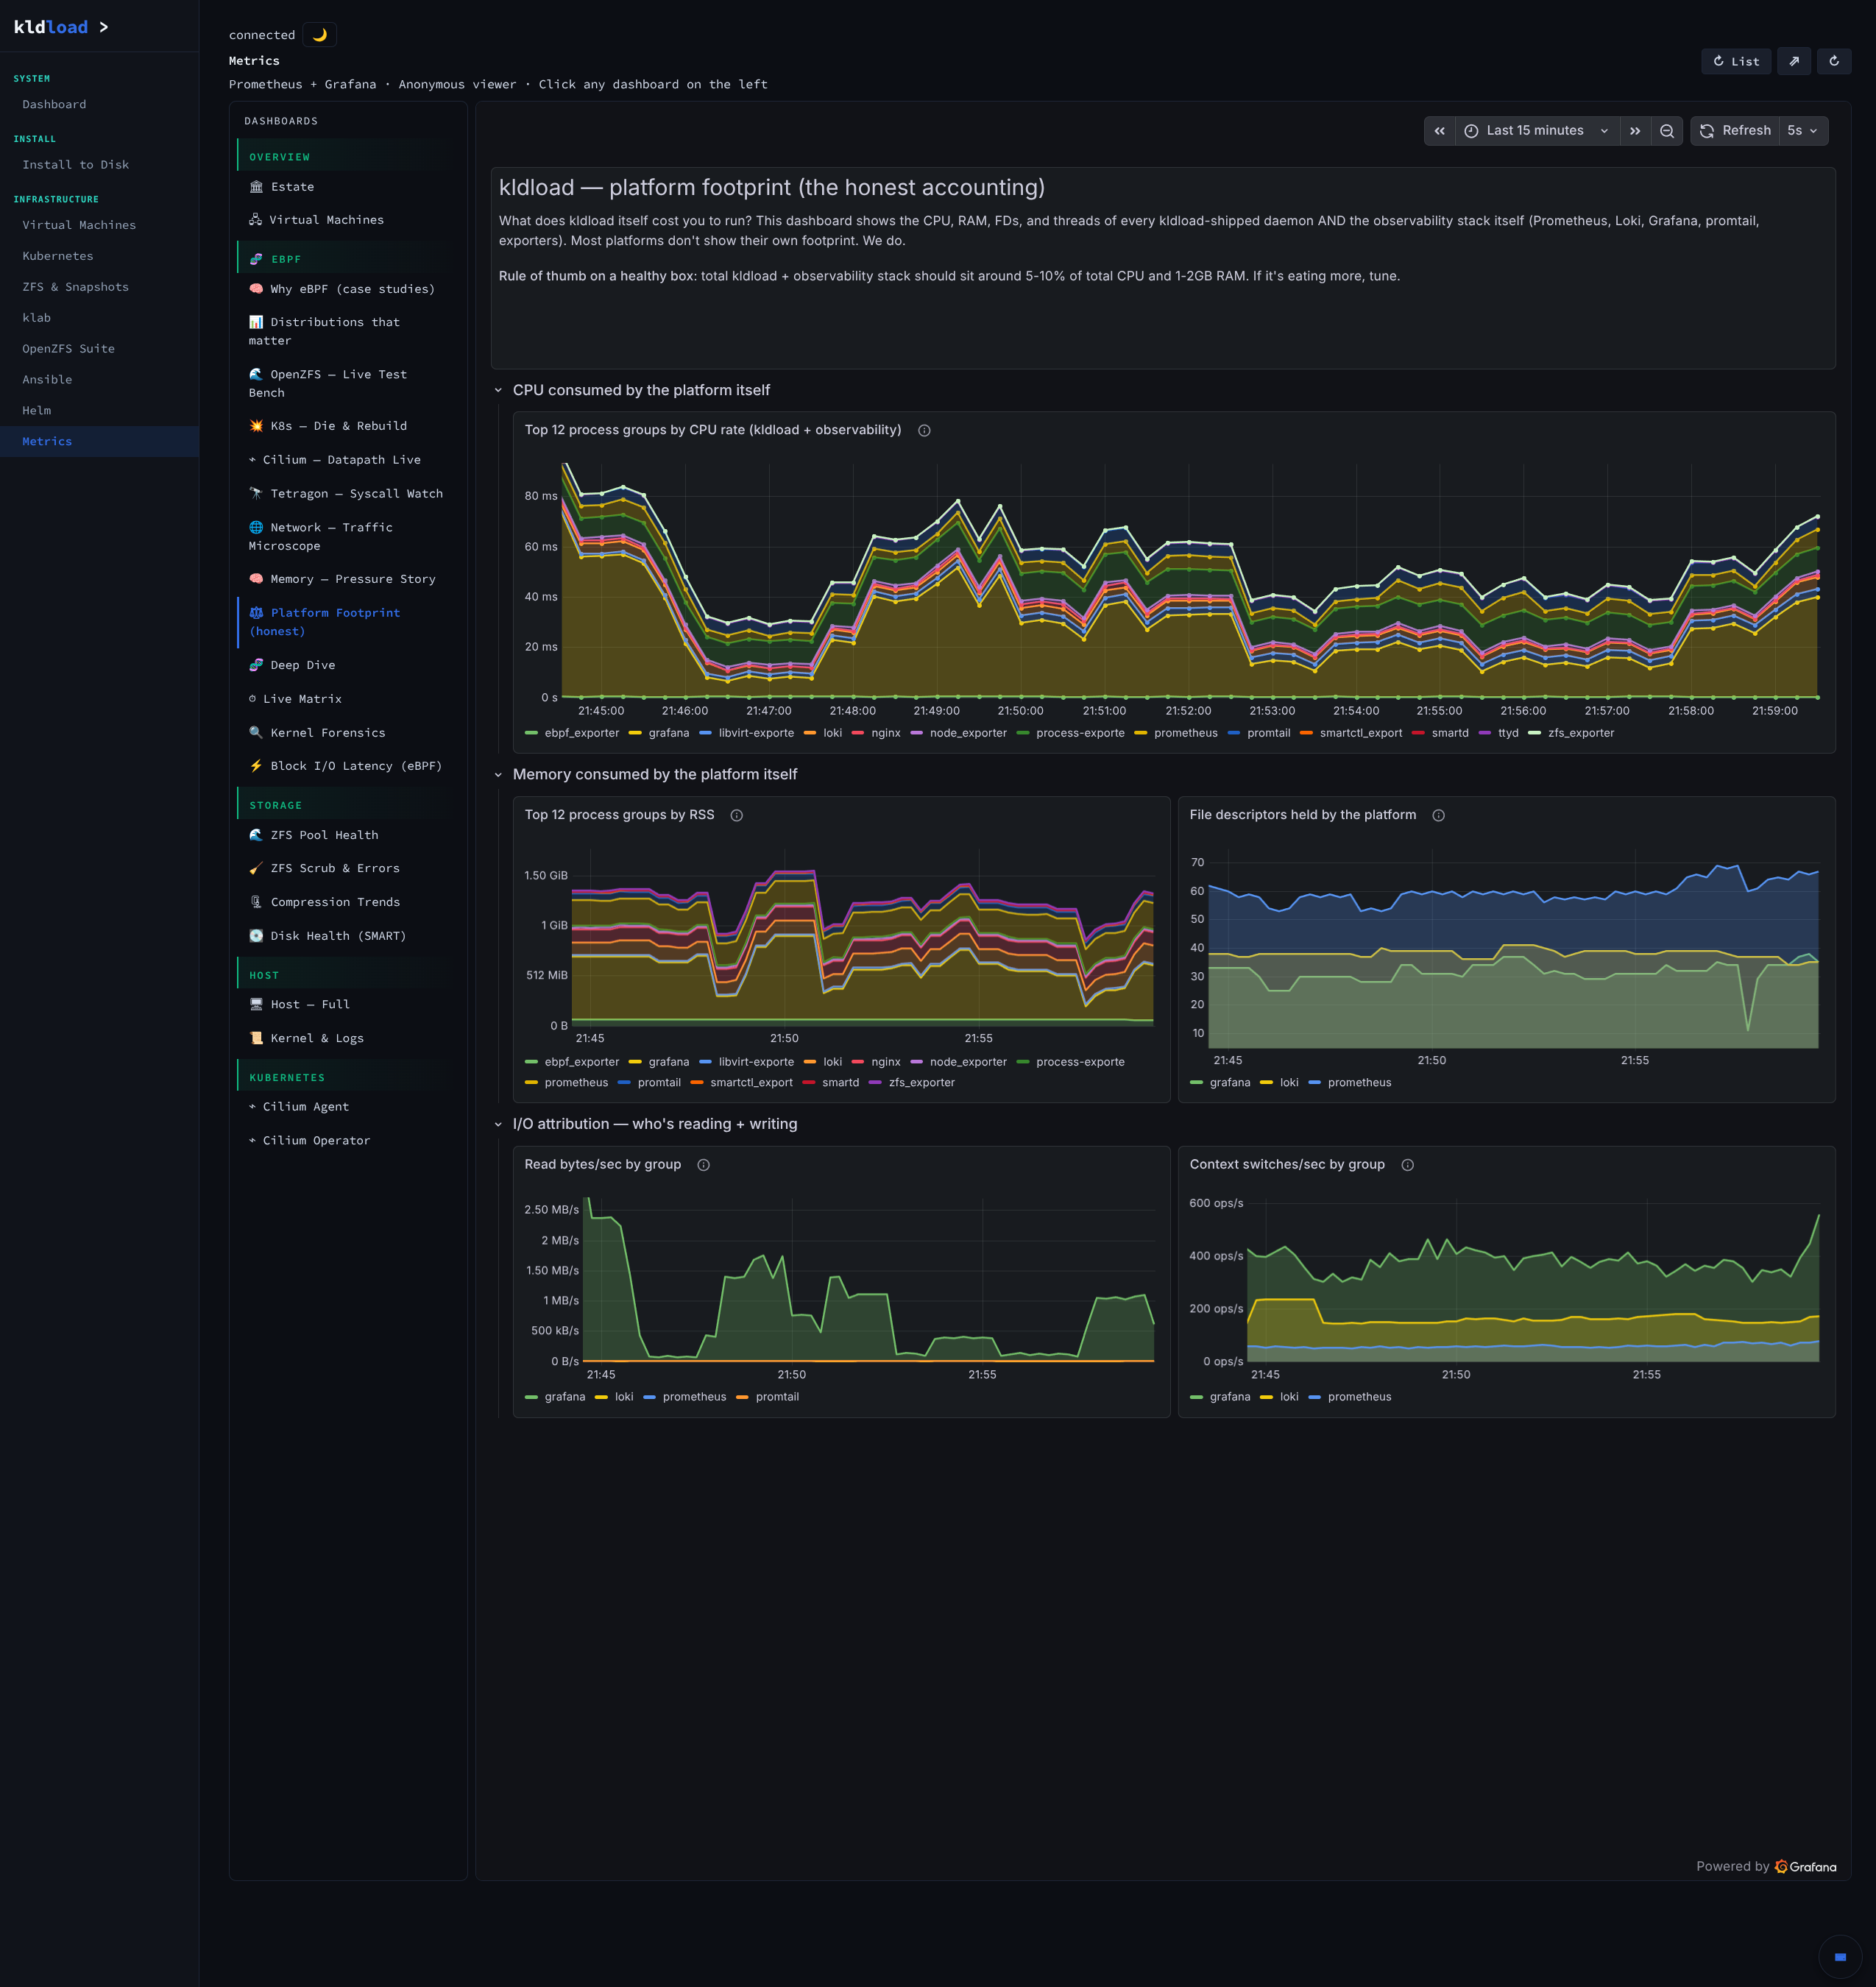
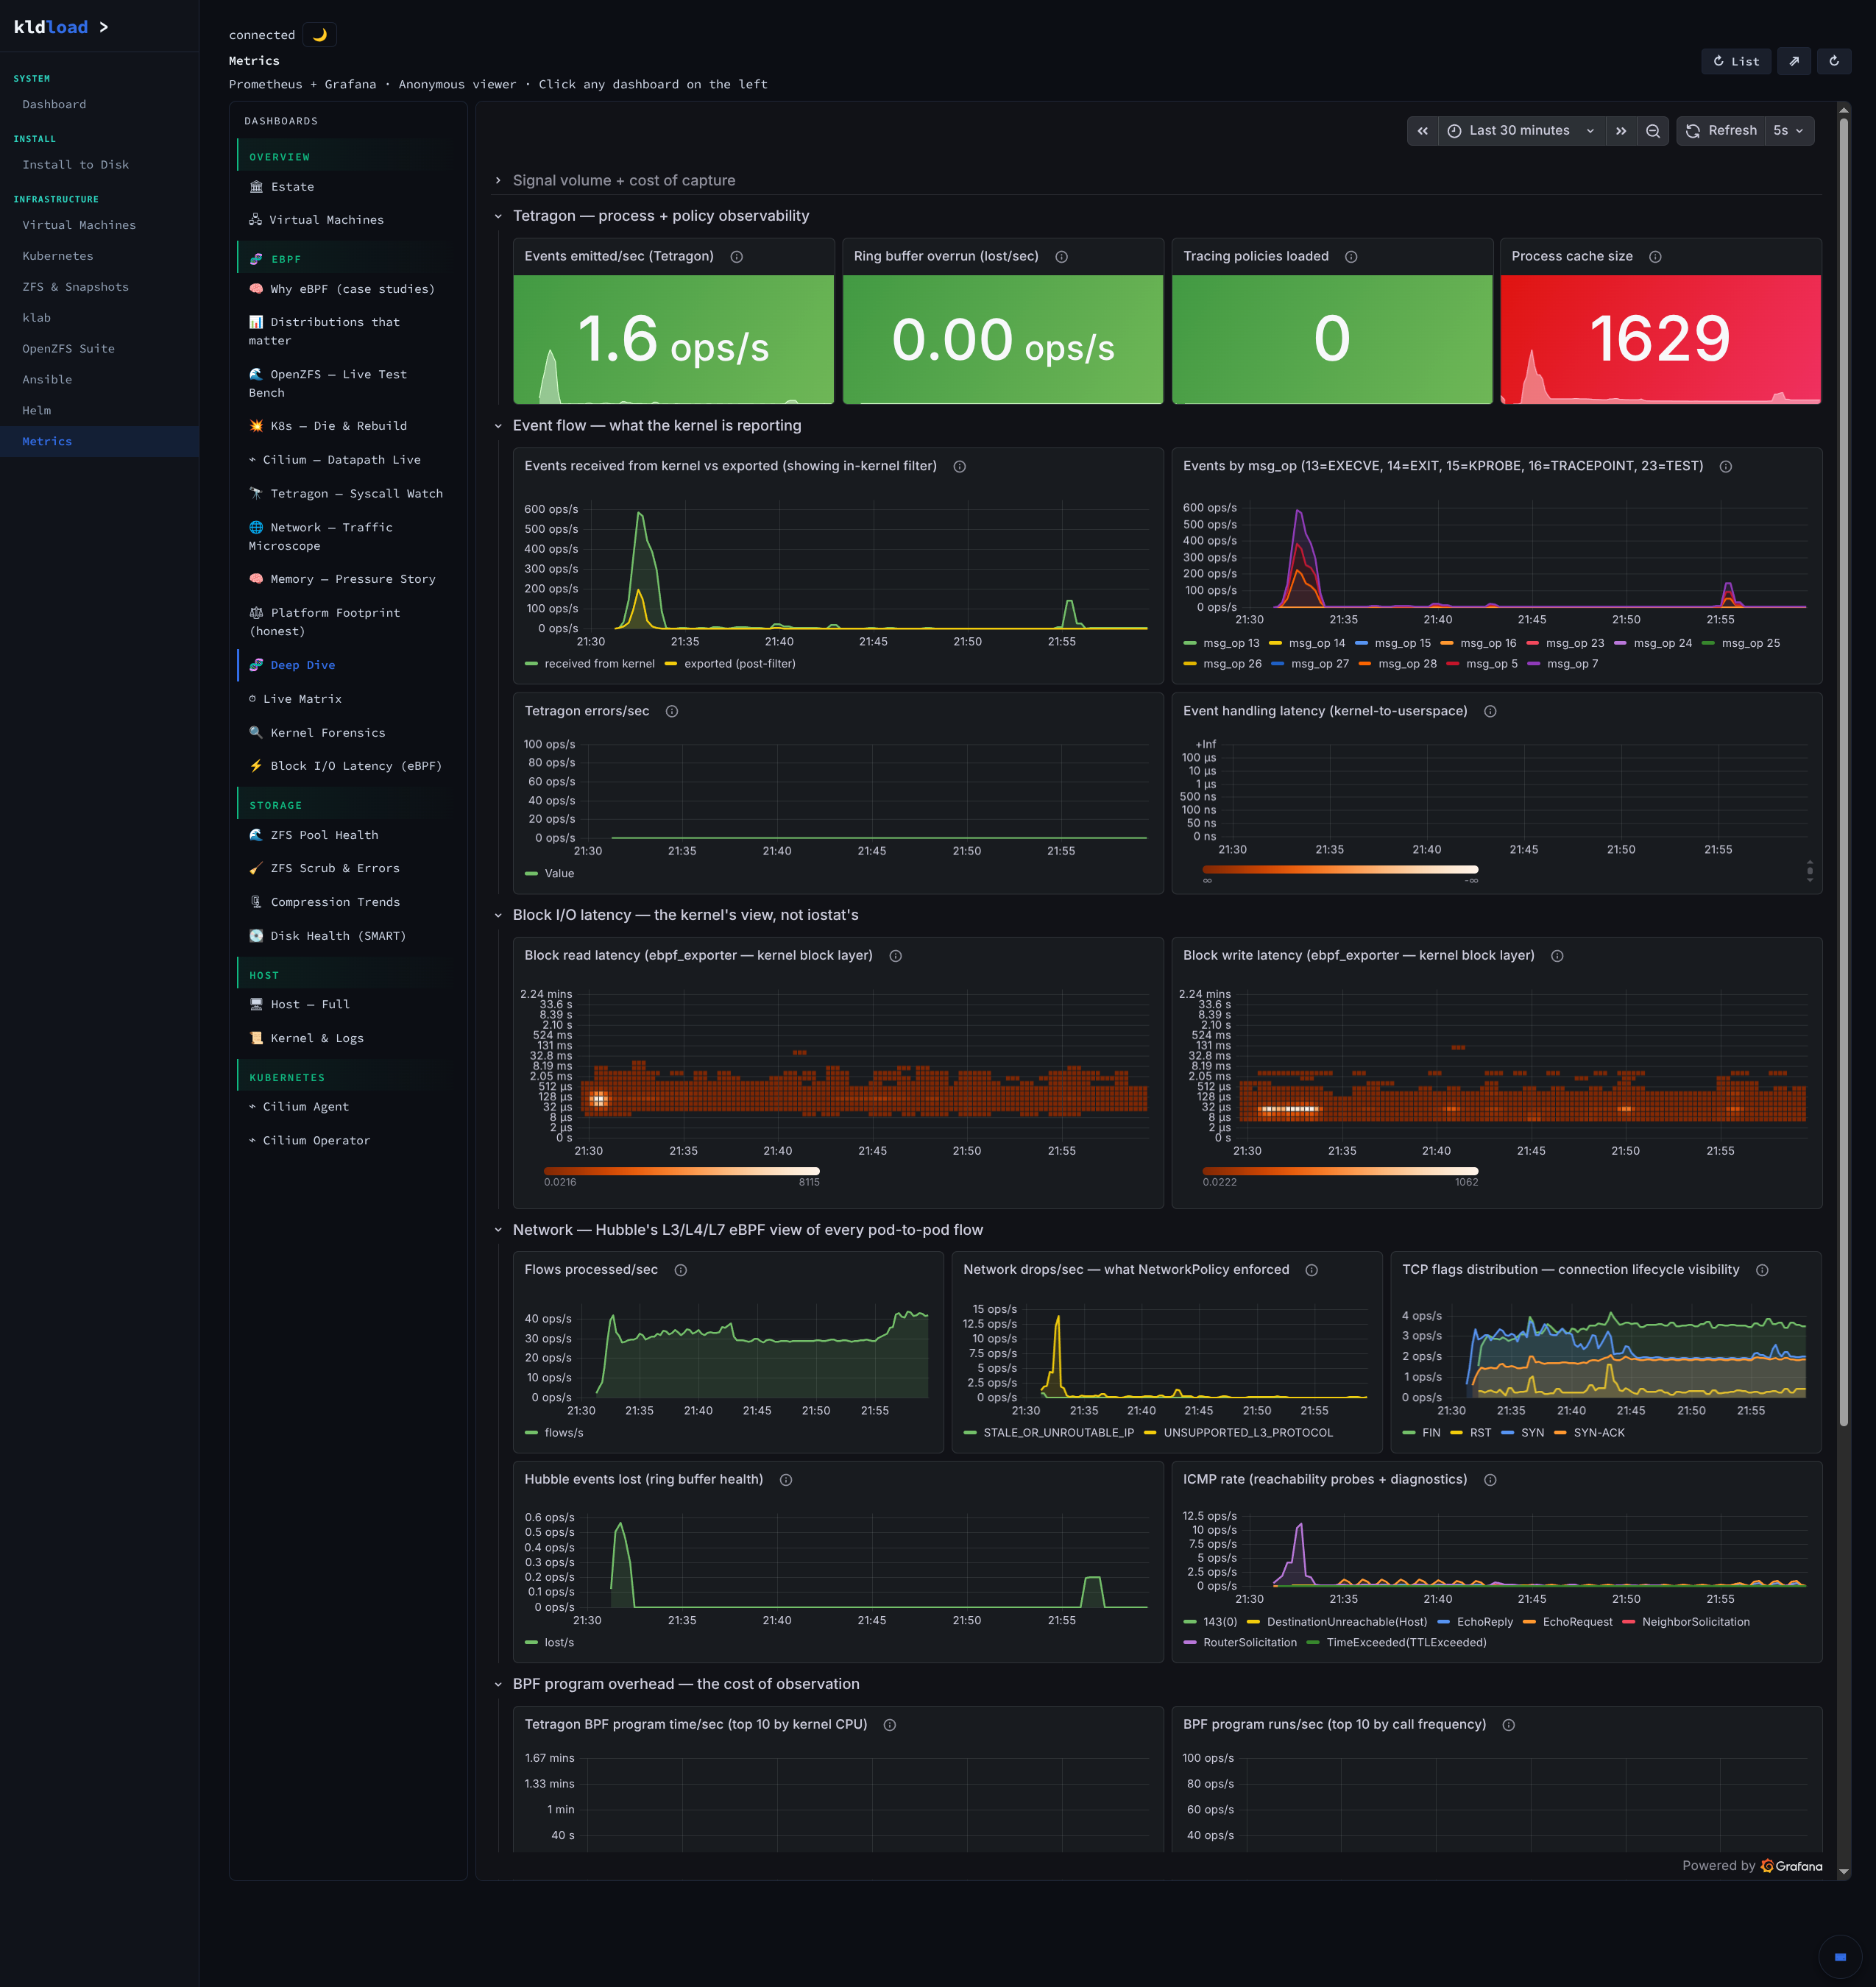
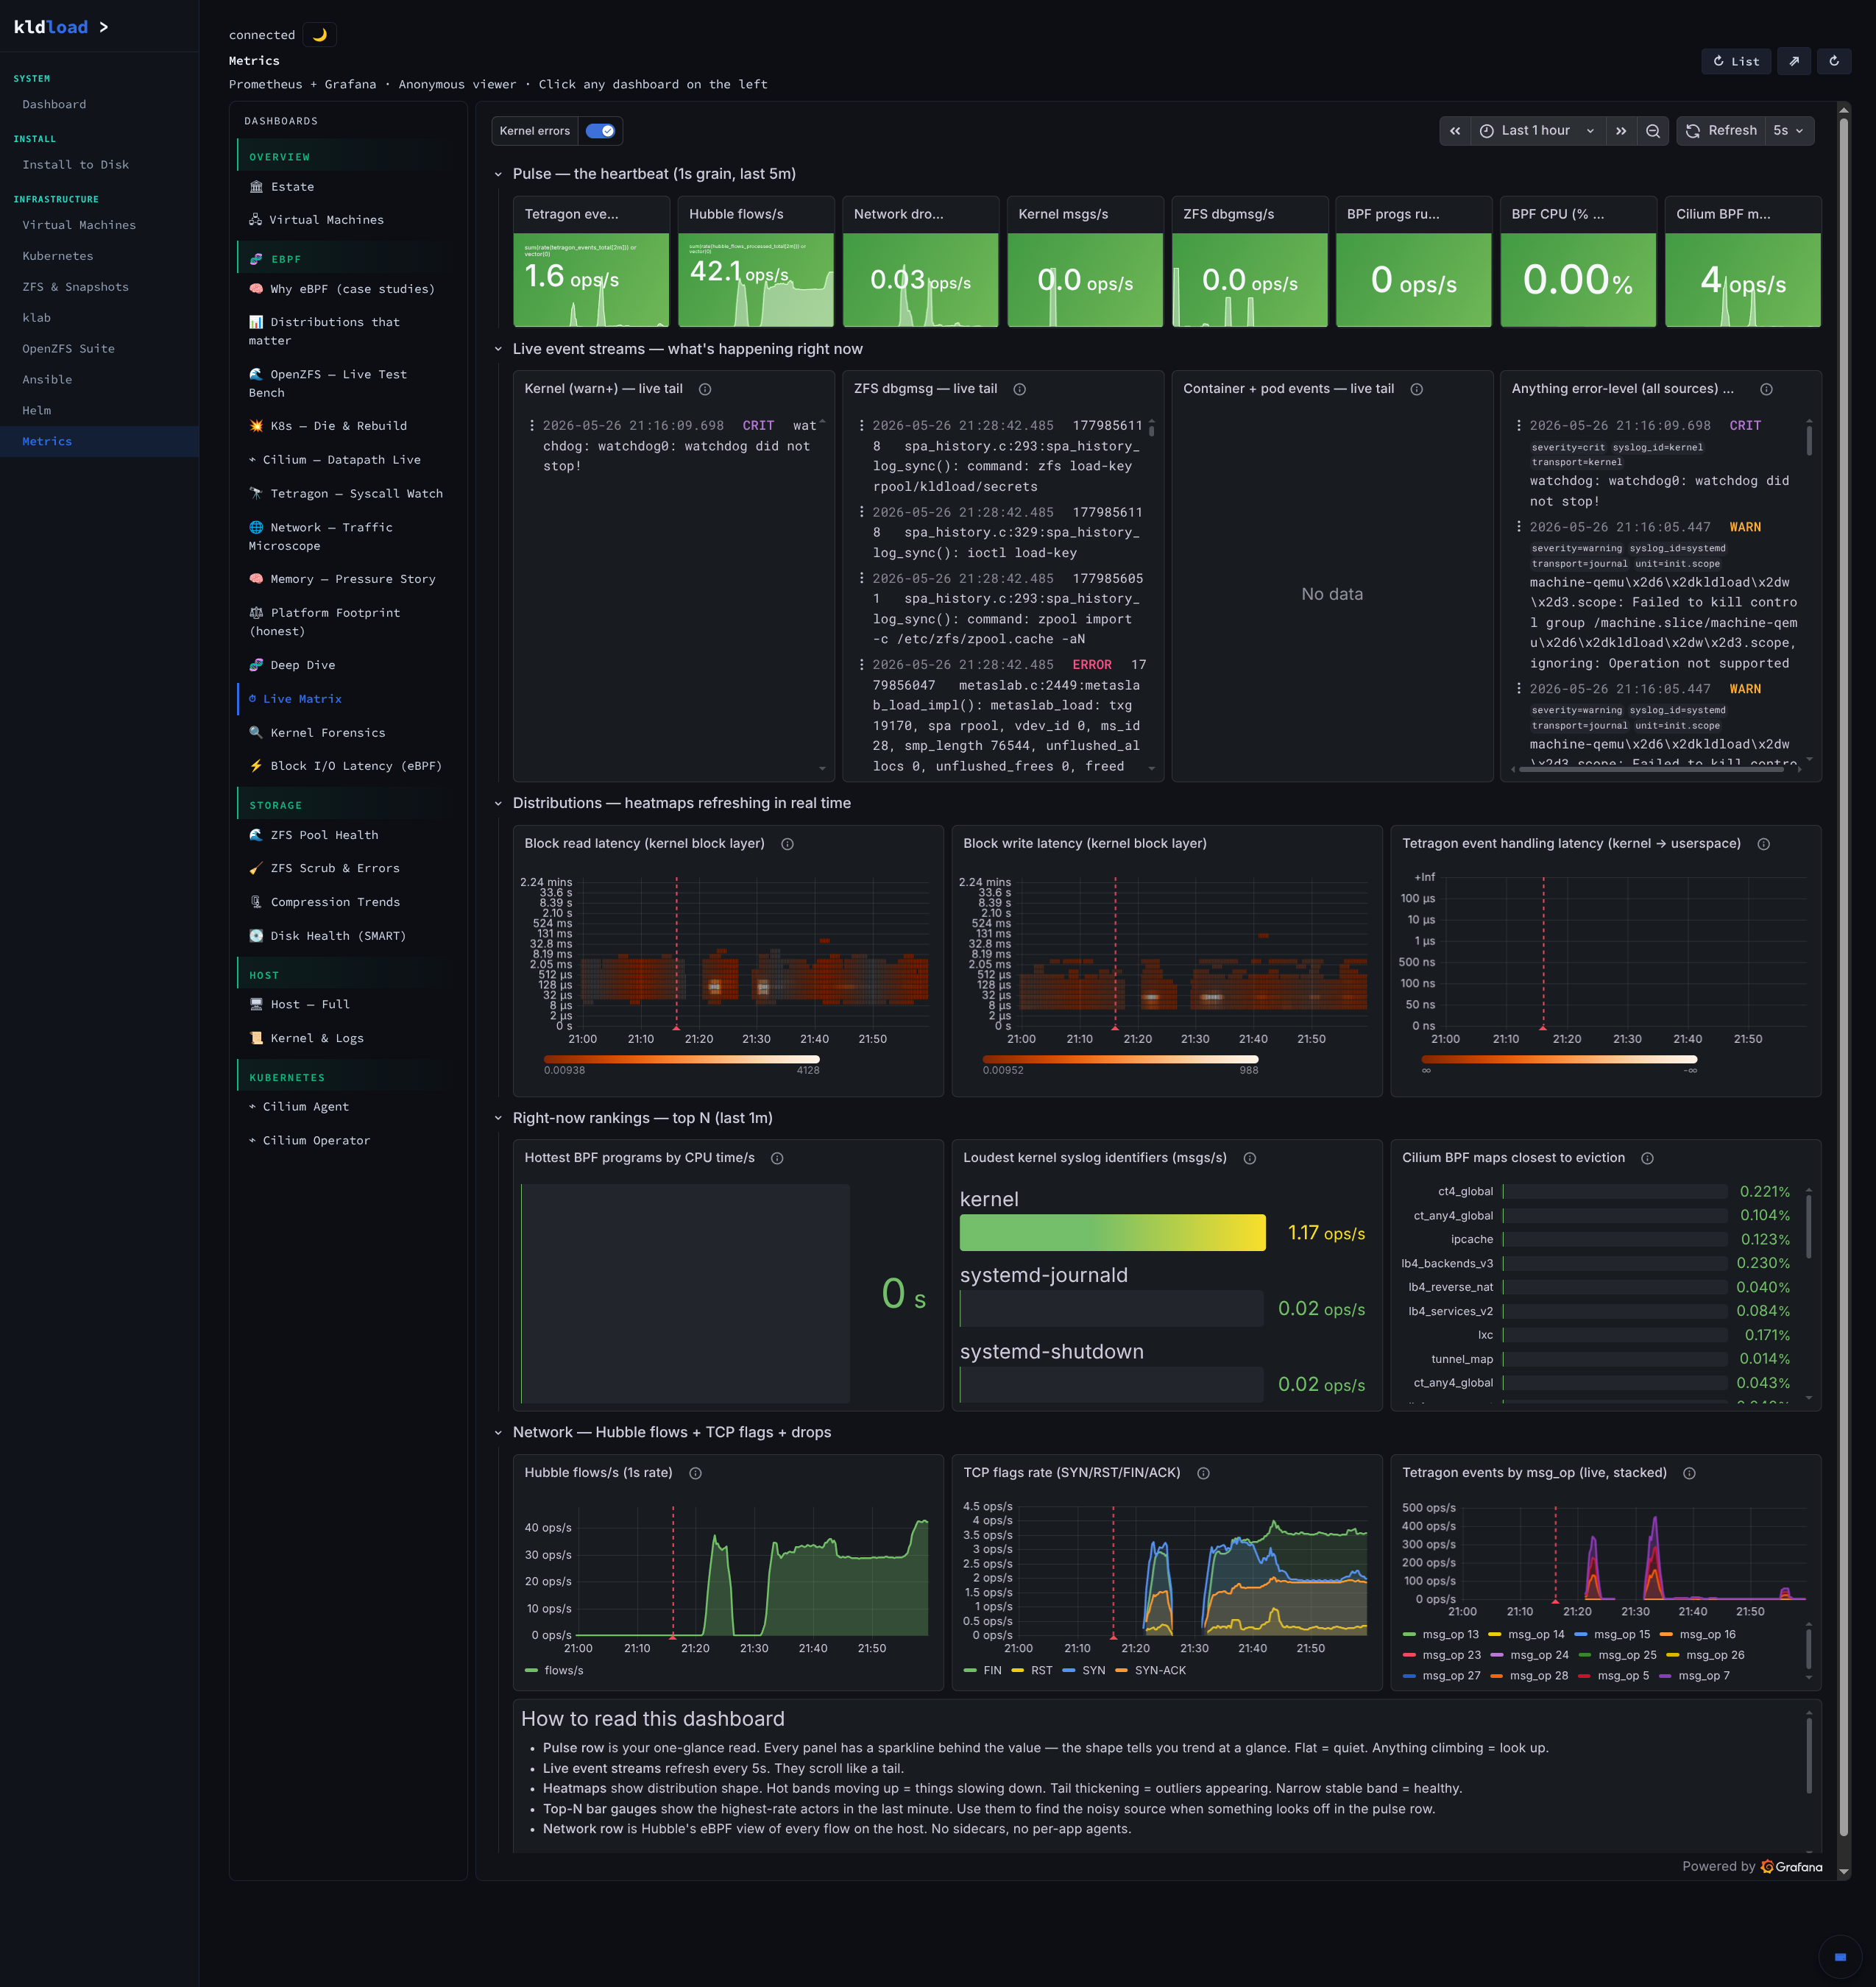
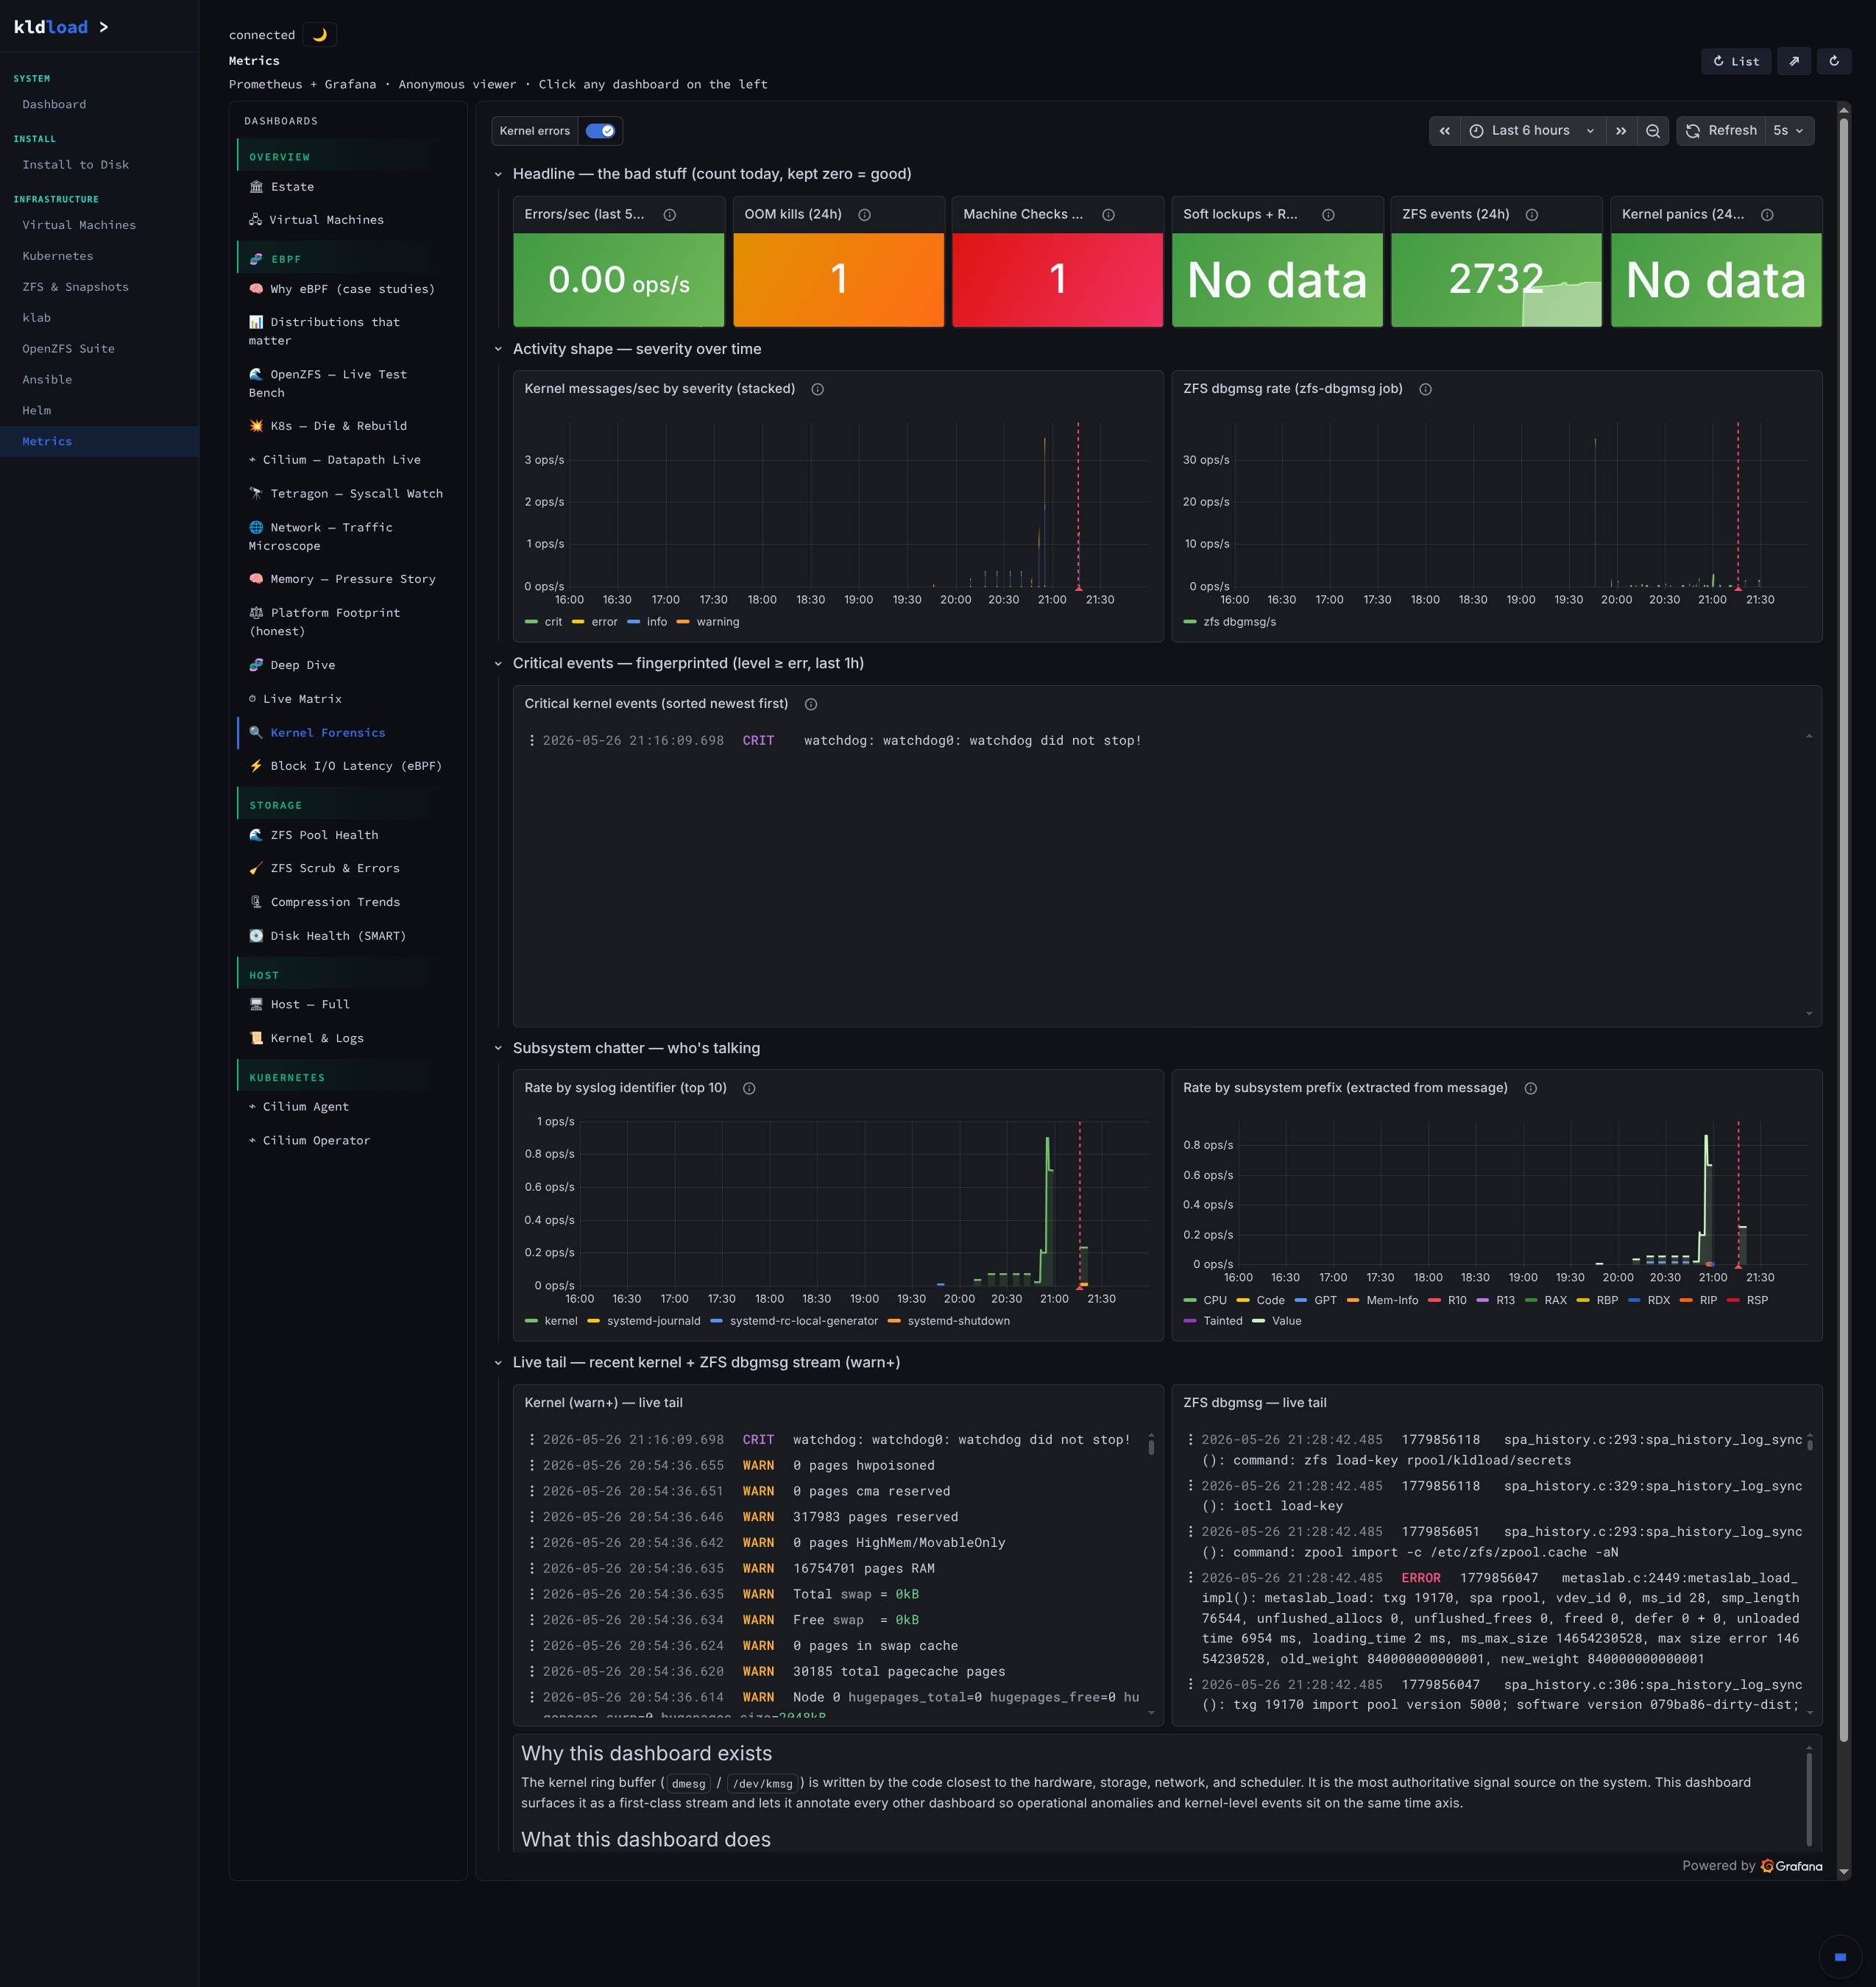
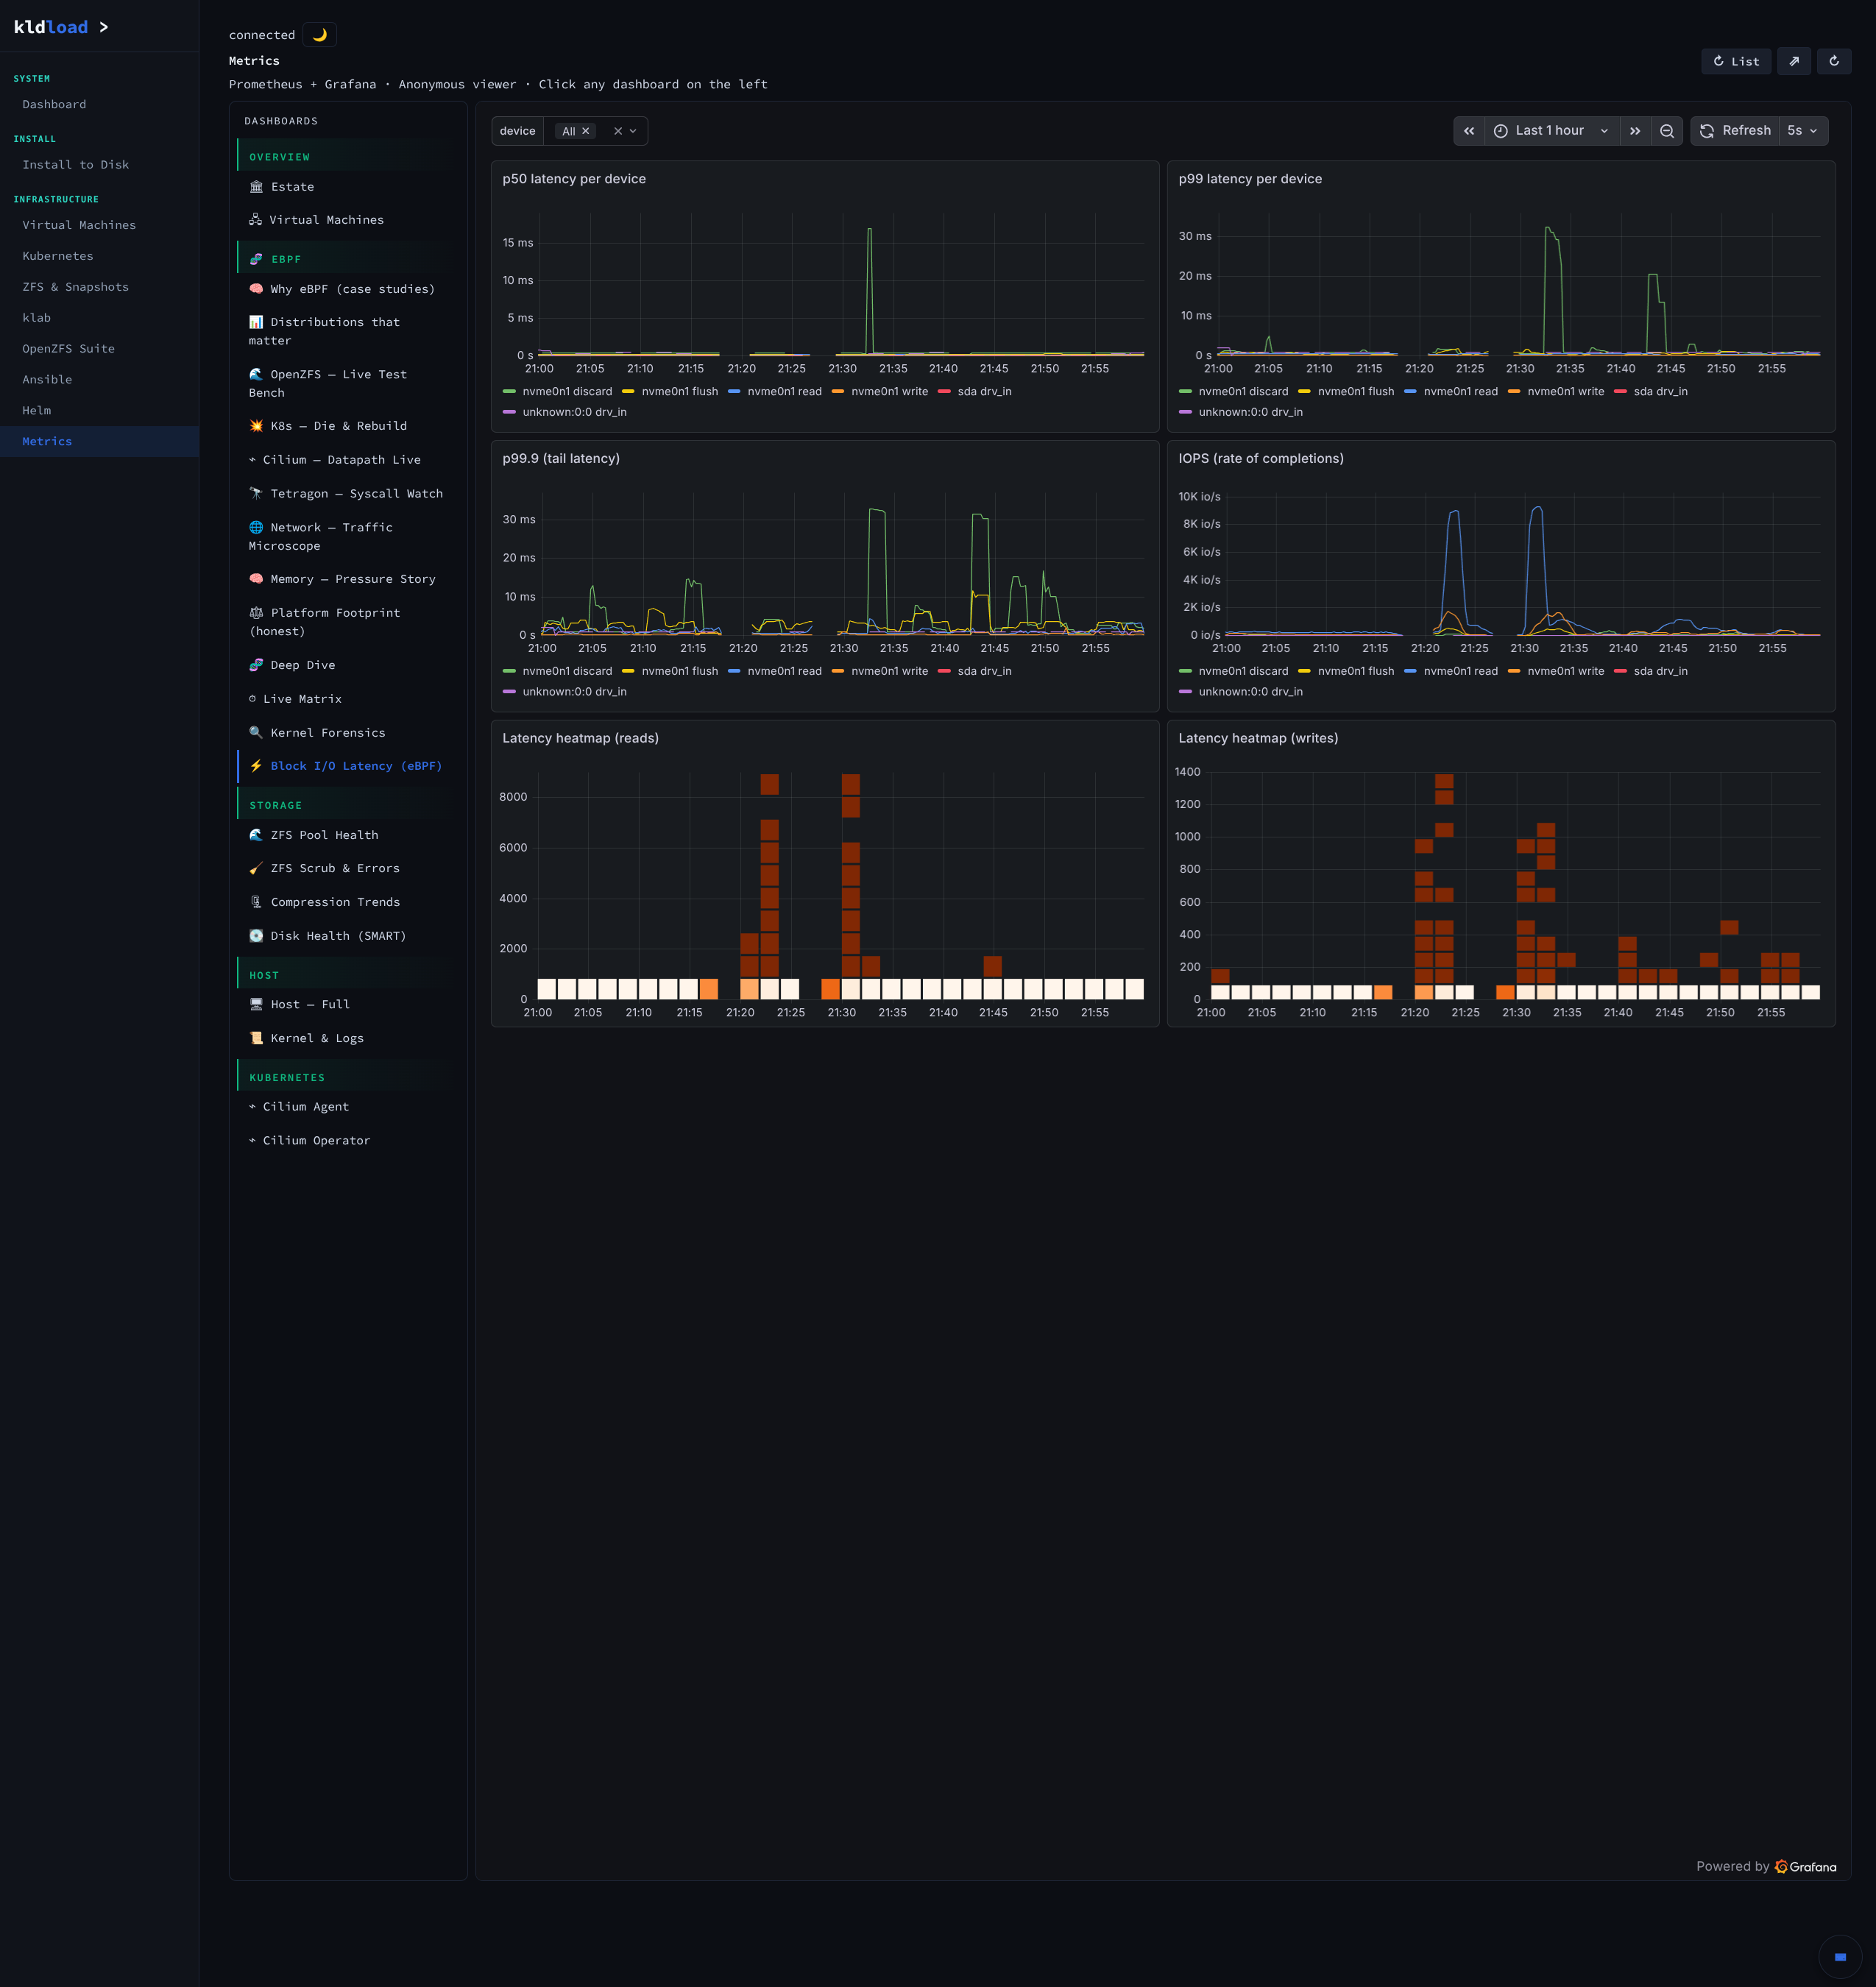
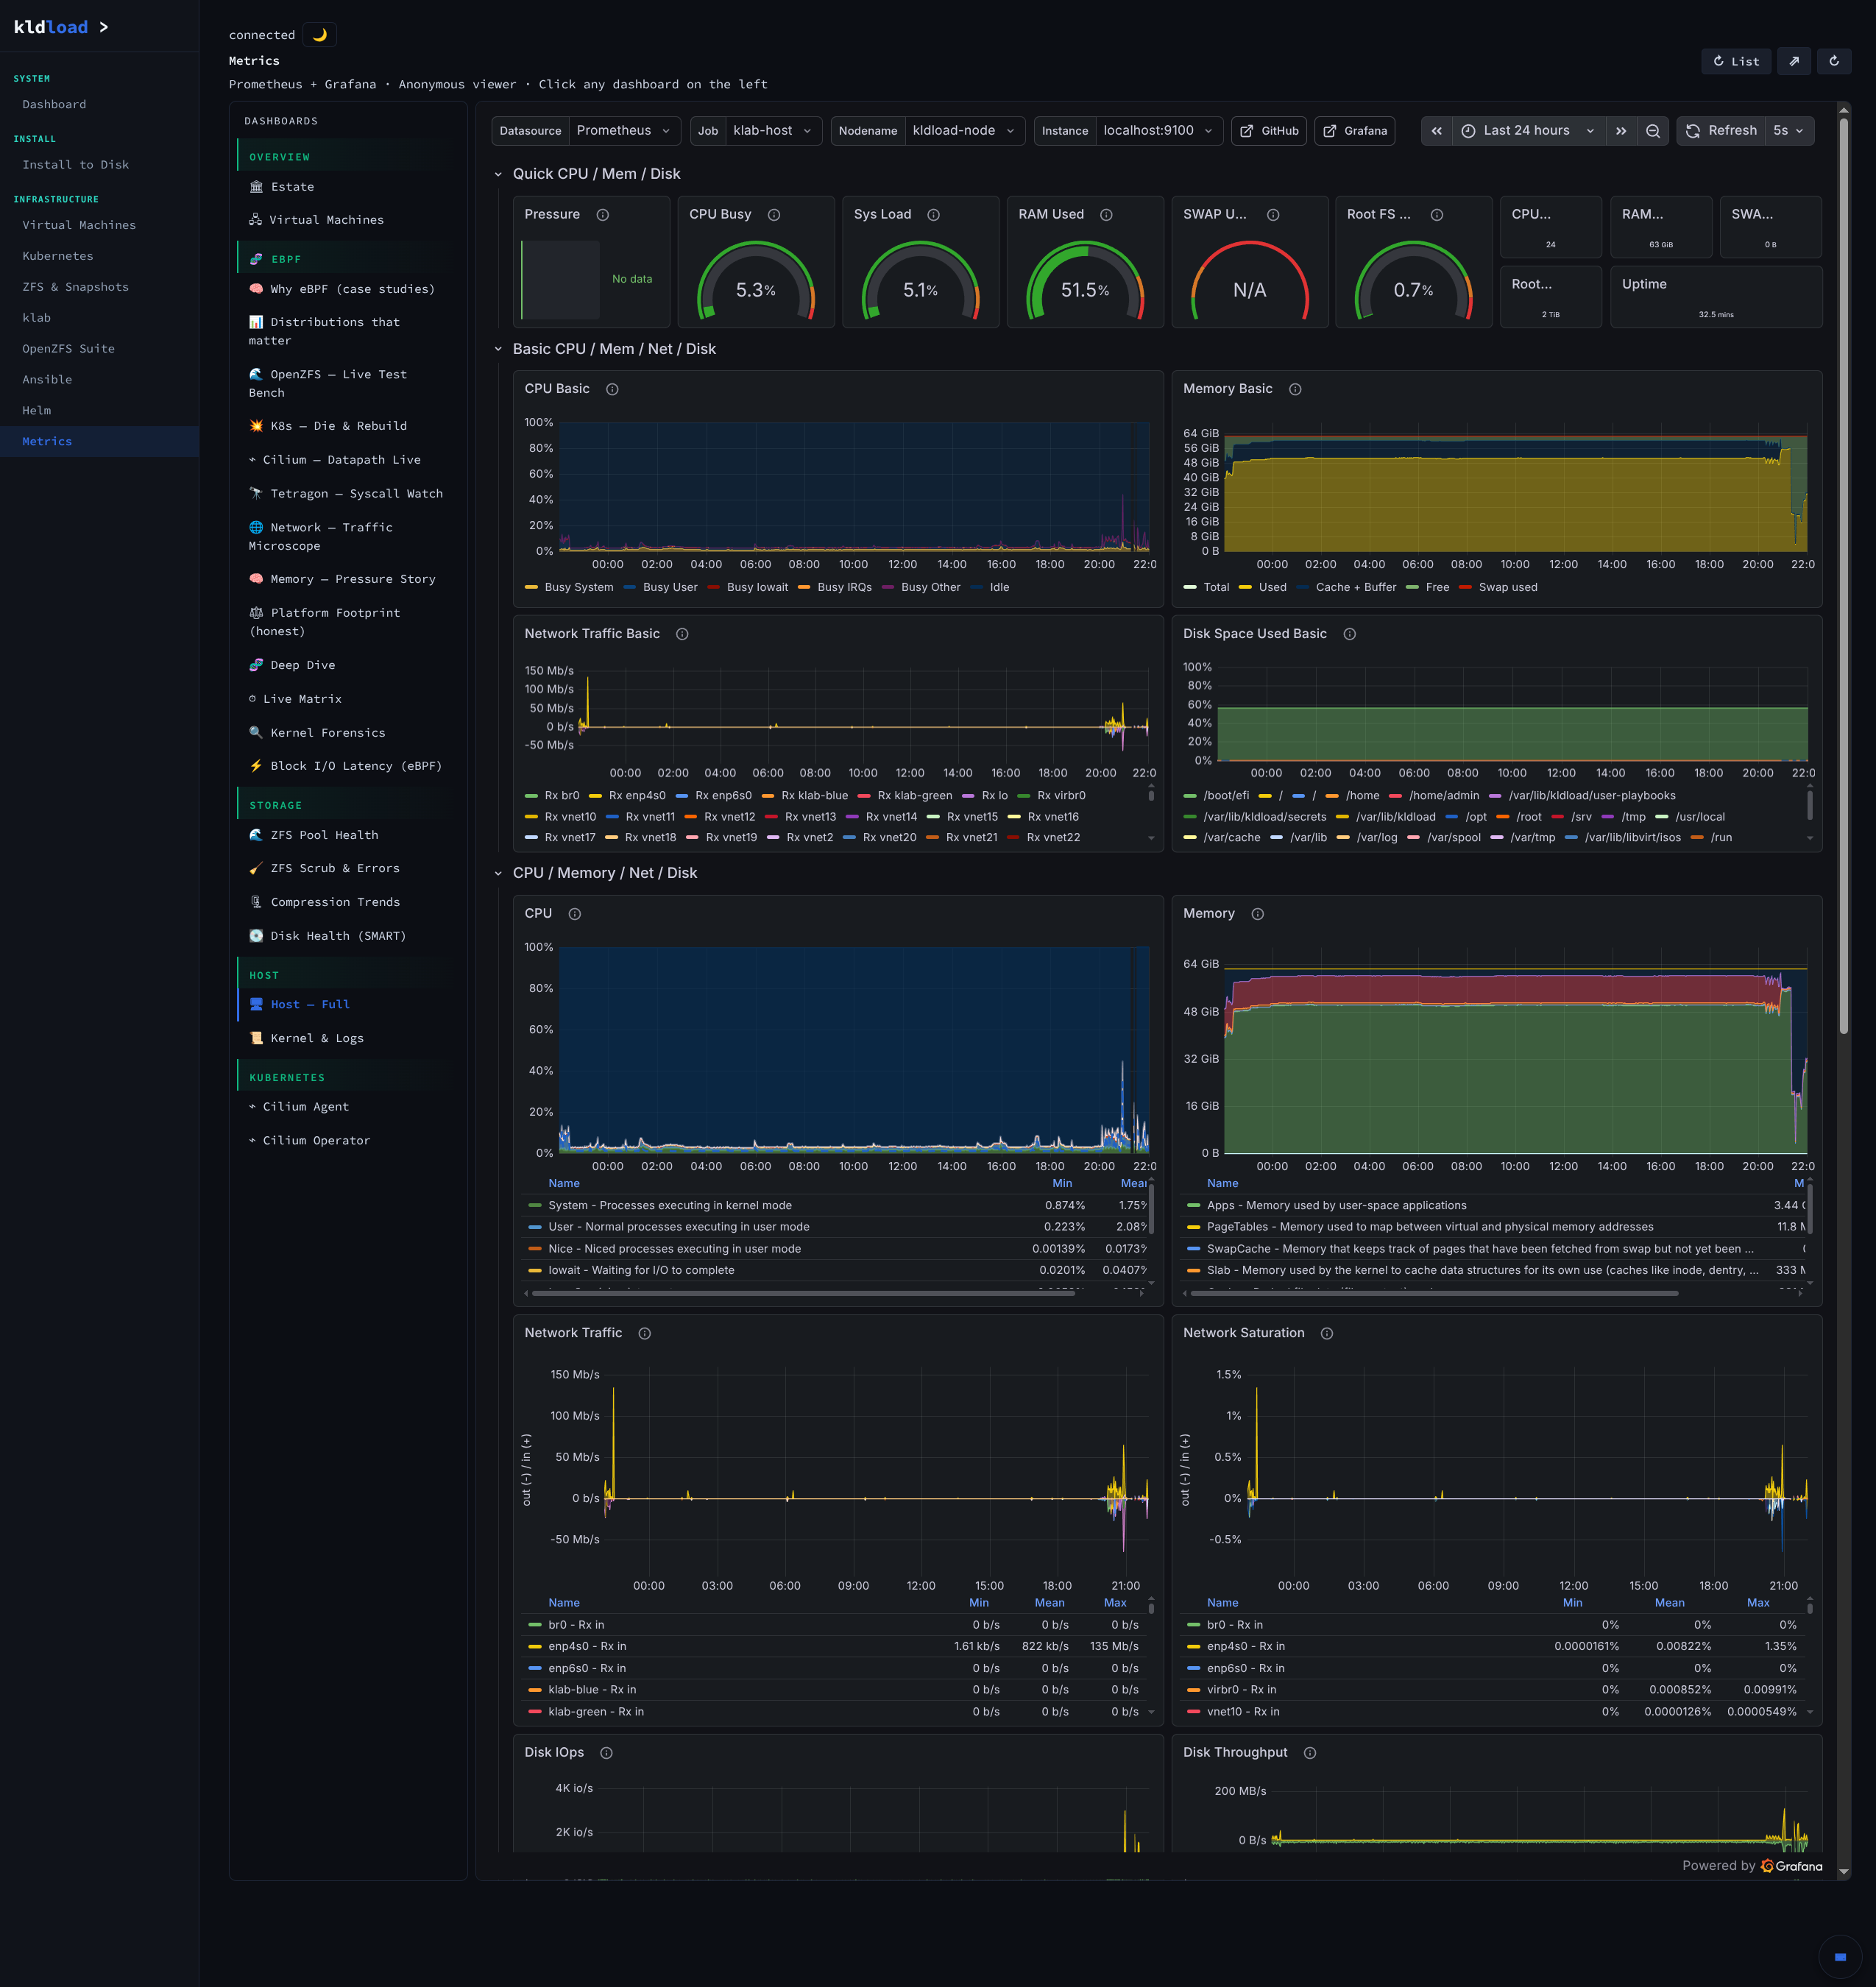
The rest of the industry sells you userland reporting: agents you install inside your app that ask the app how it’s feeling, sampled, batched, shipped to a cloud, billed by the gigabyte, surfaced 30 seconds later. That’s “the app told us what it did.” The kldload stack is the inverse: probes attached below the workload, in the kernel, narrating what the hardware actually did. The app can’t lie about a syscall it’s currently making; it can lie about what it logs.
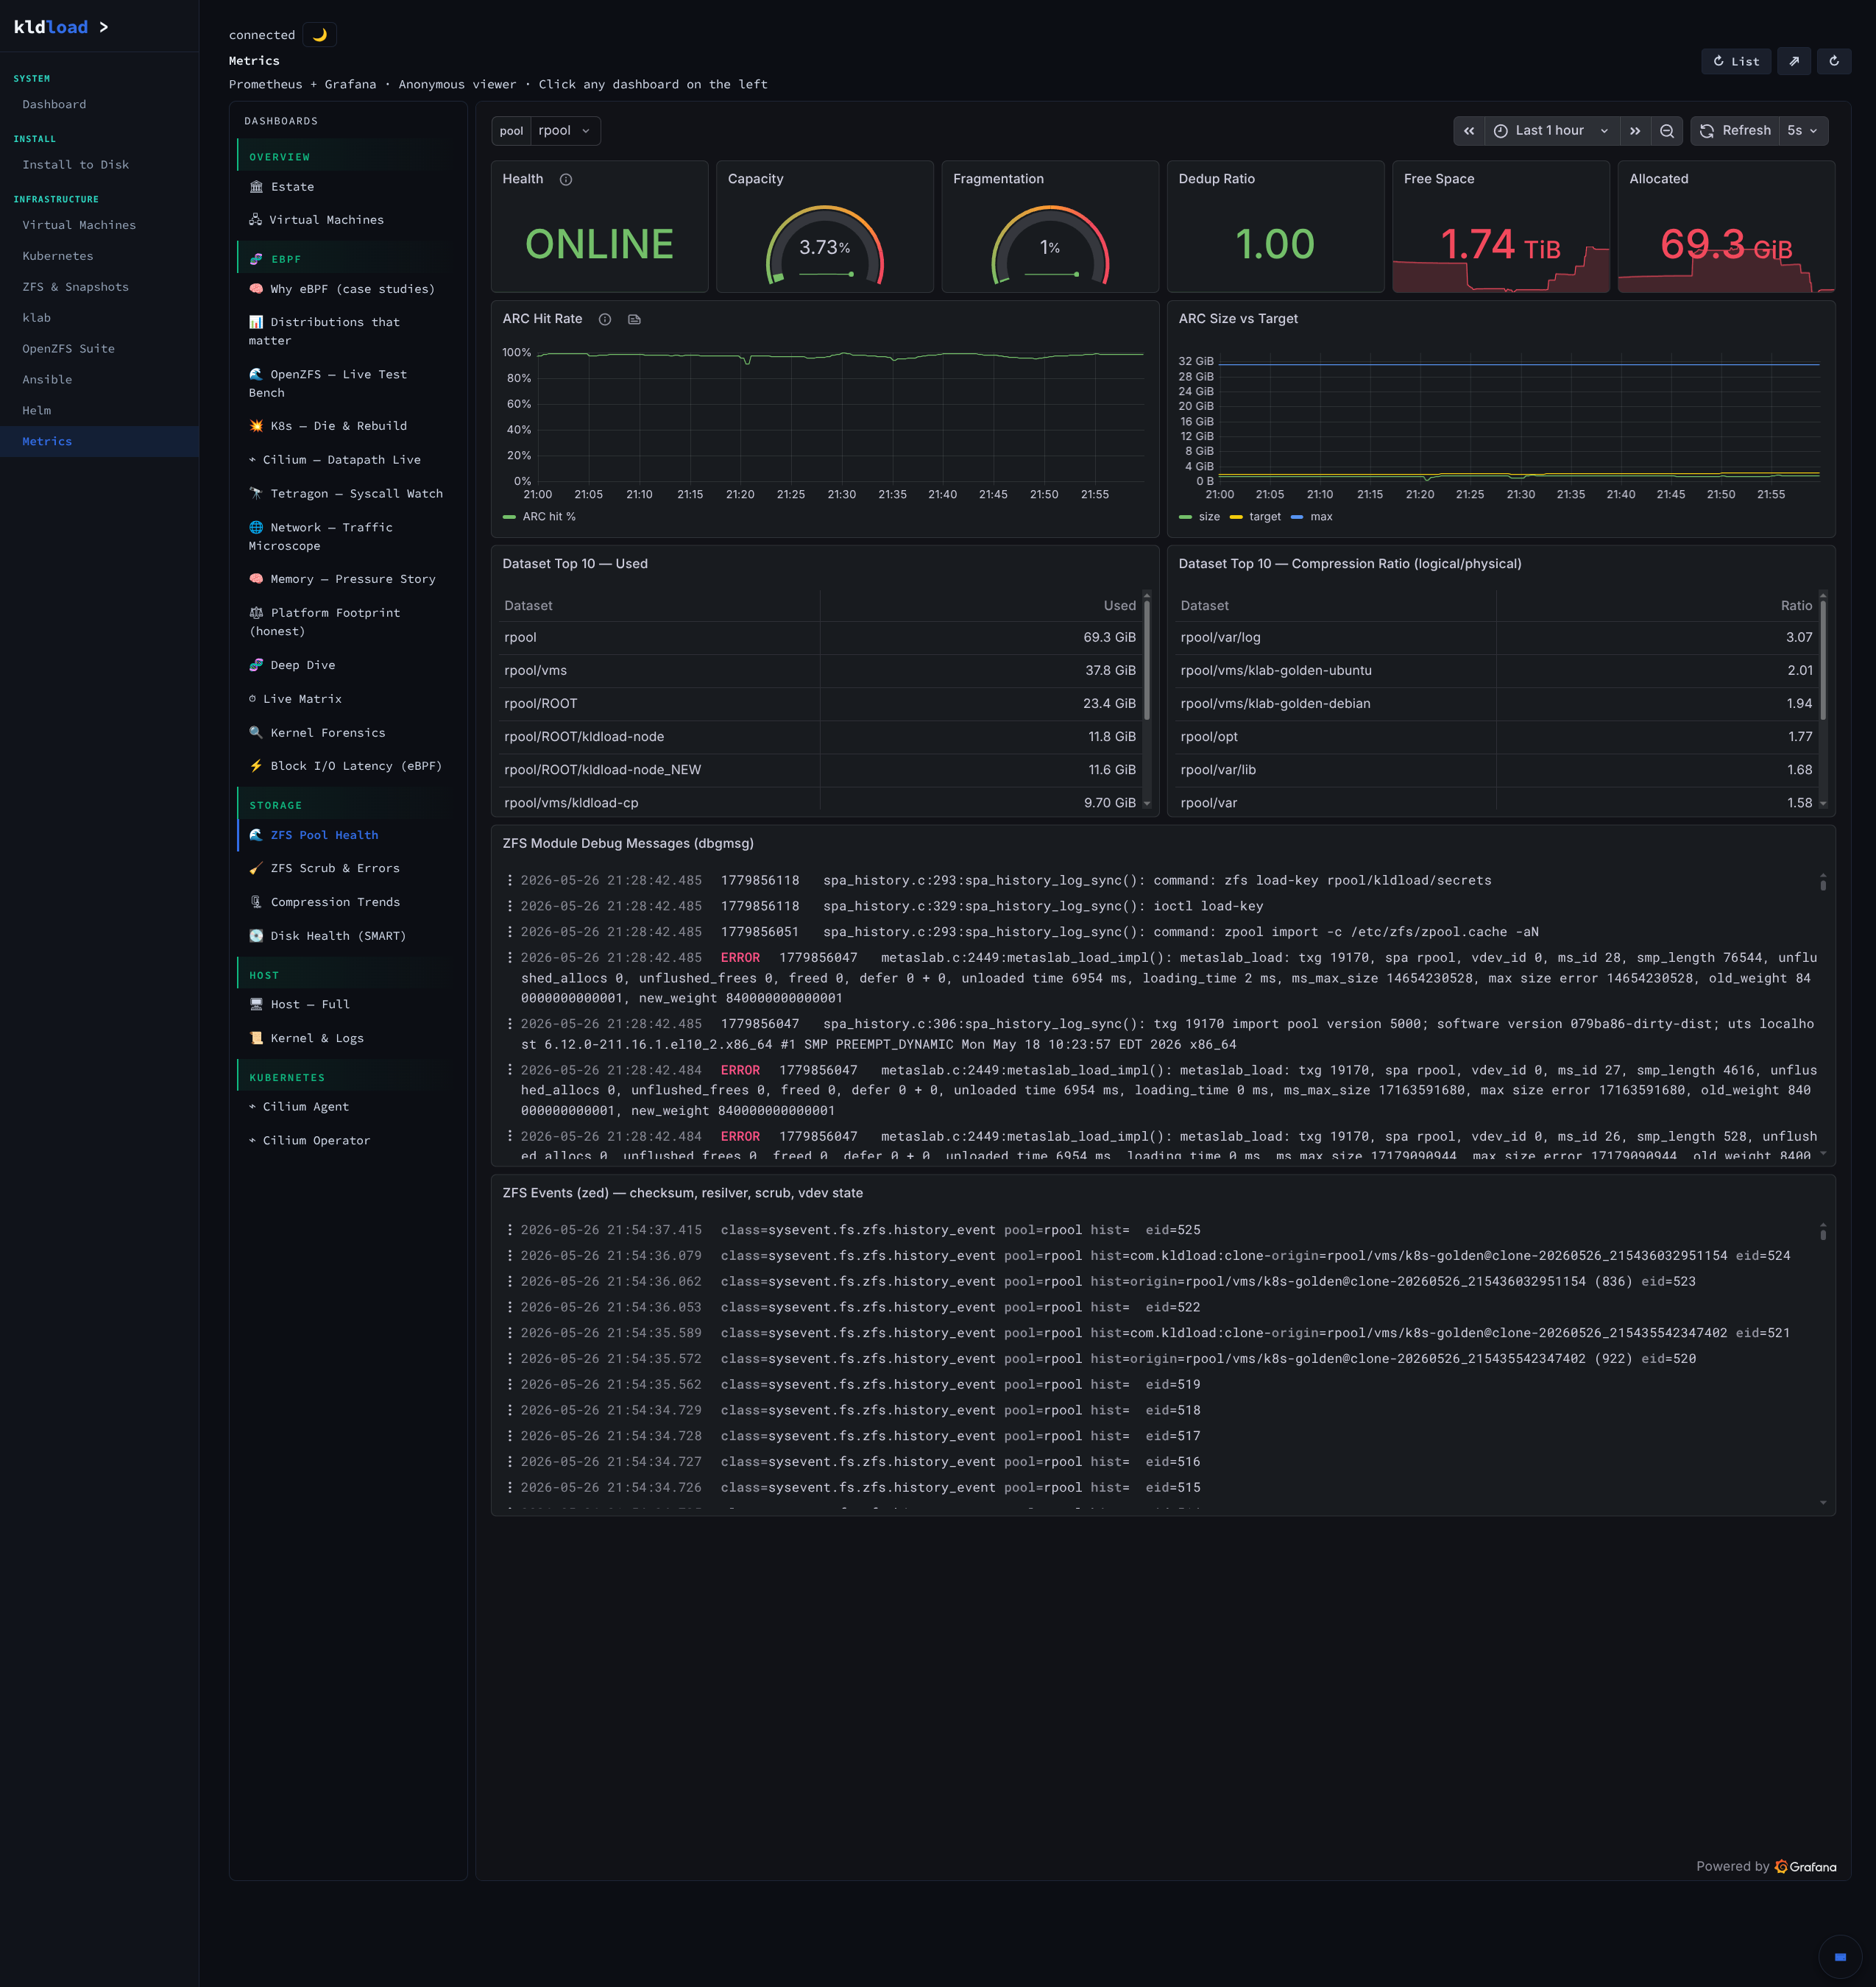
Think of it as xray vision for your infrastructure. Userland tools look at the skin. The stack on this page looks through the skin at the bones — the syscalls executed, the packets classified, the blocks read, the txg synced, the metaslab loaded, the BPF program counted. Second source of truth, always-on, local, ready at boot.
Everything that’s running, before you ever logged in
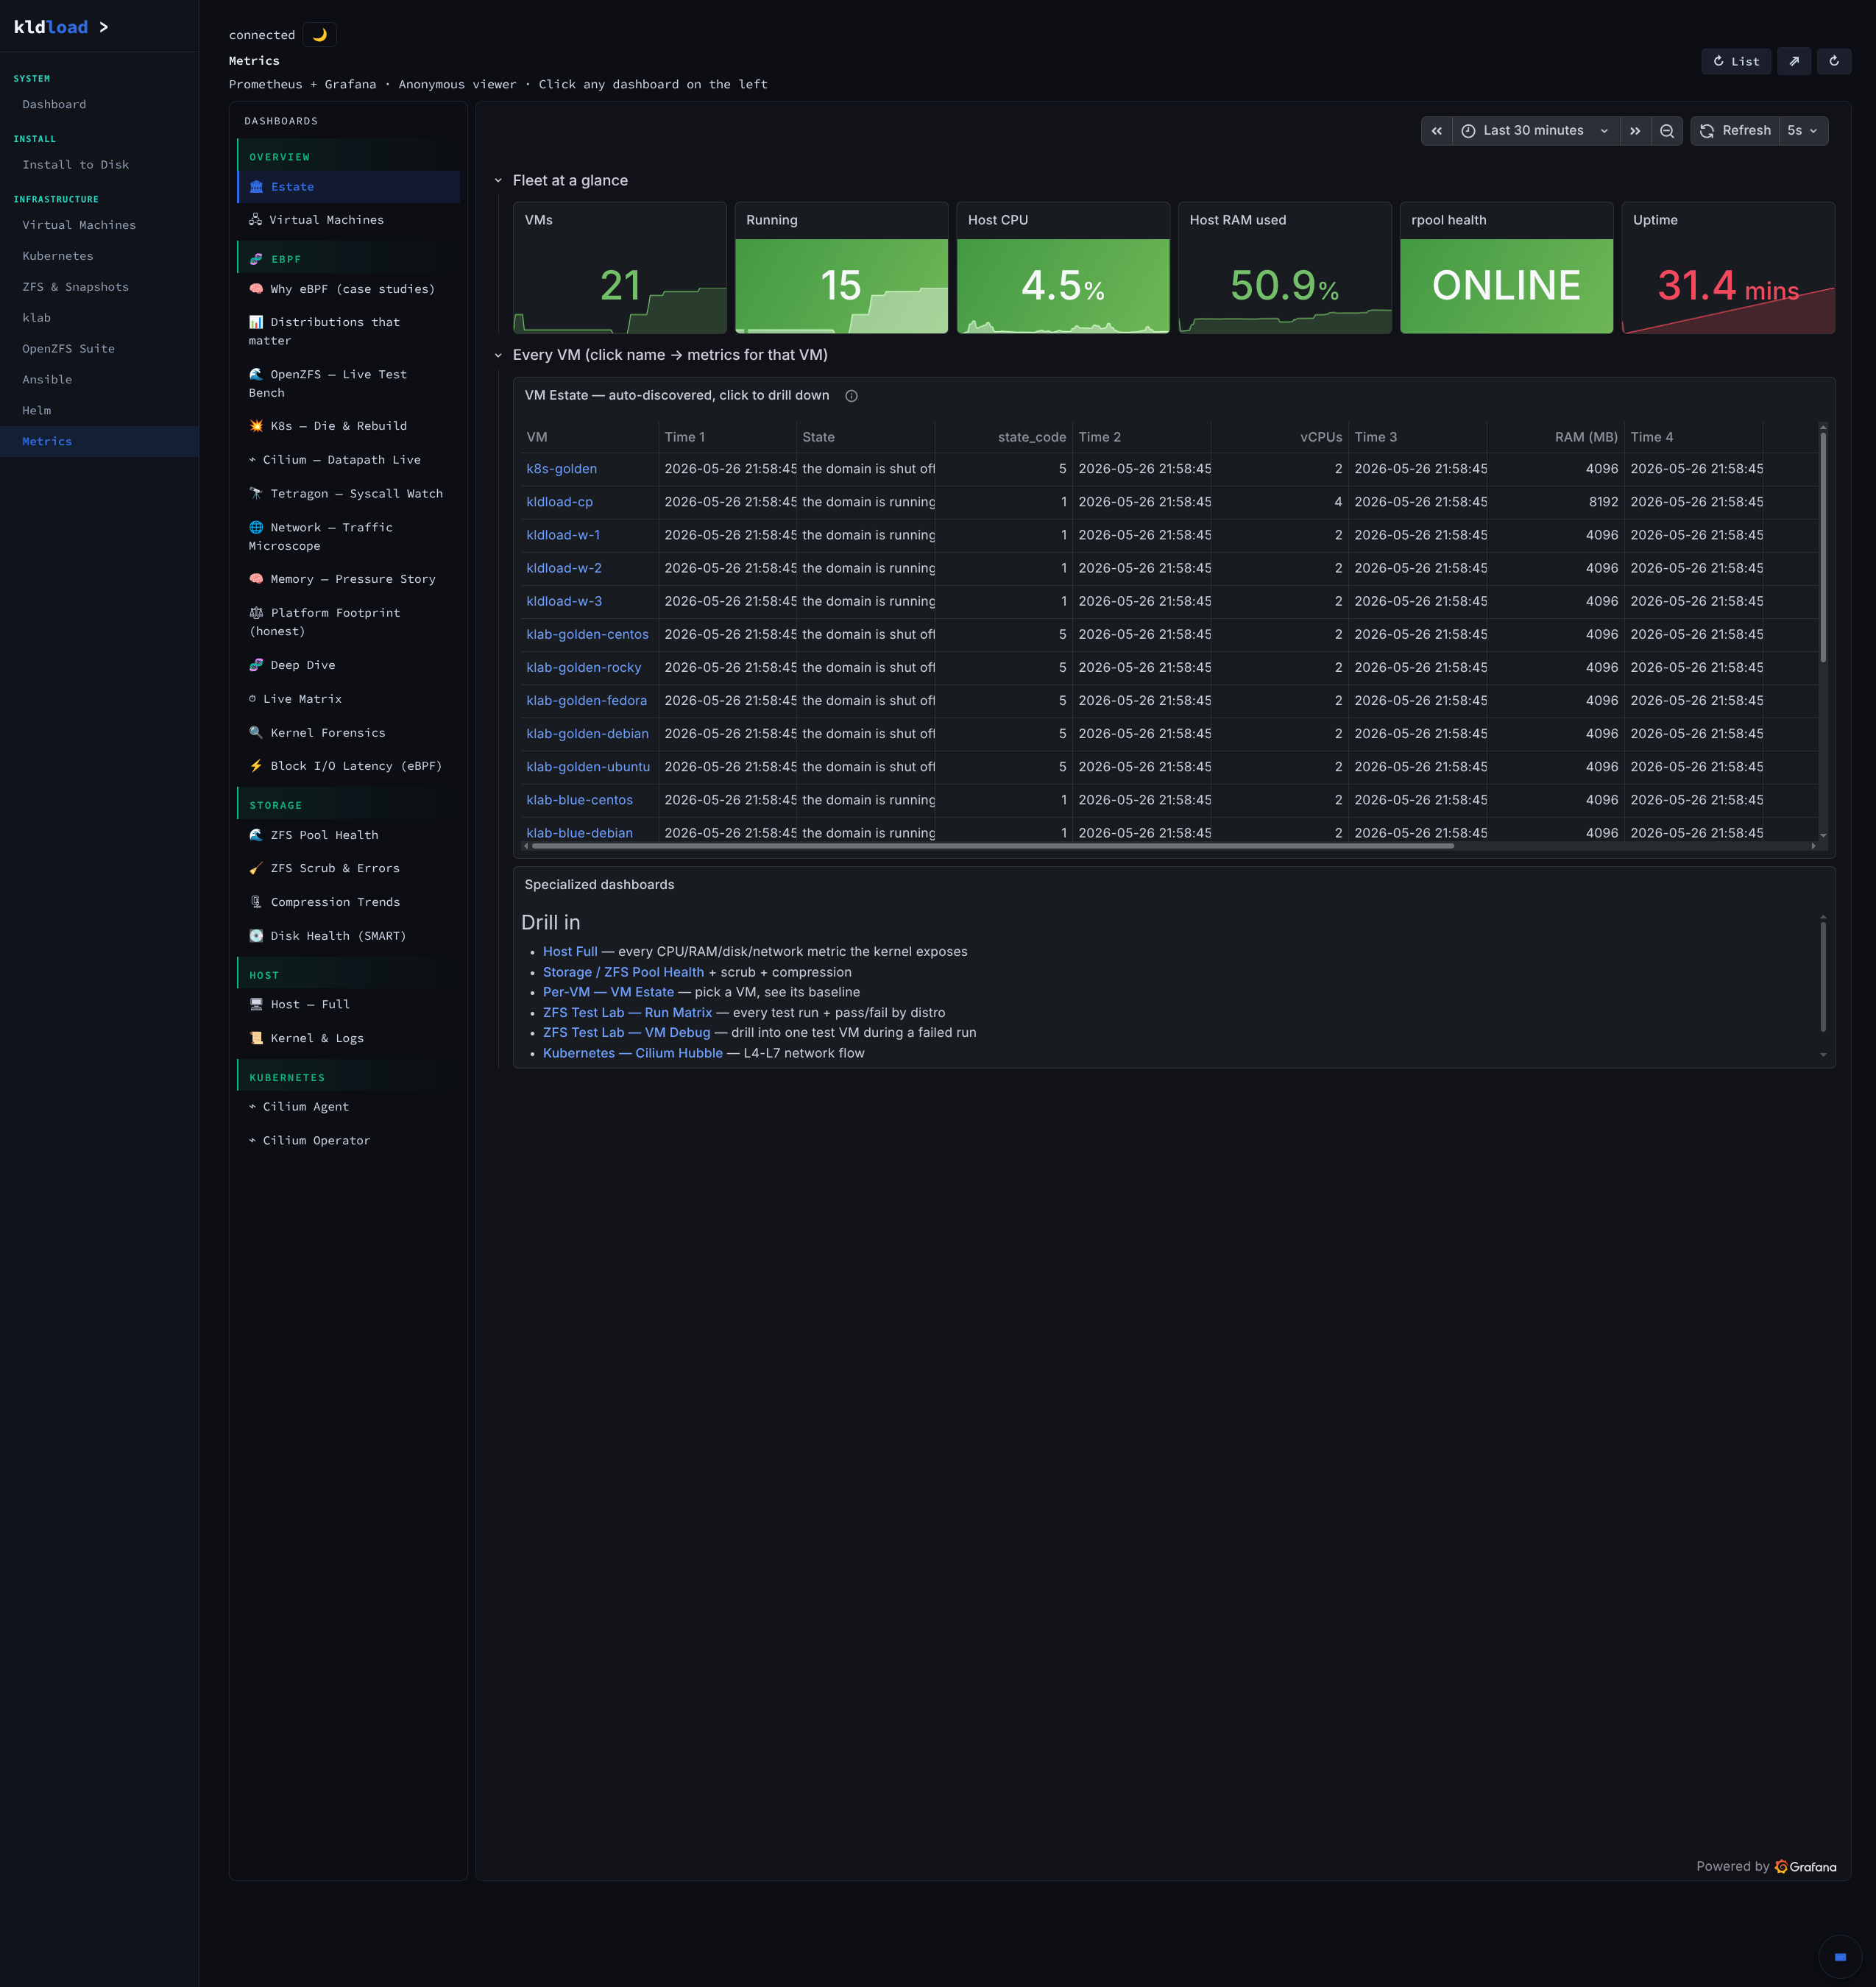
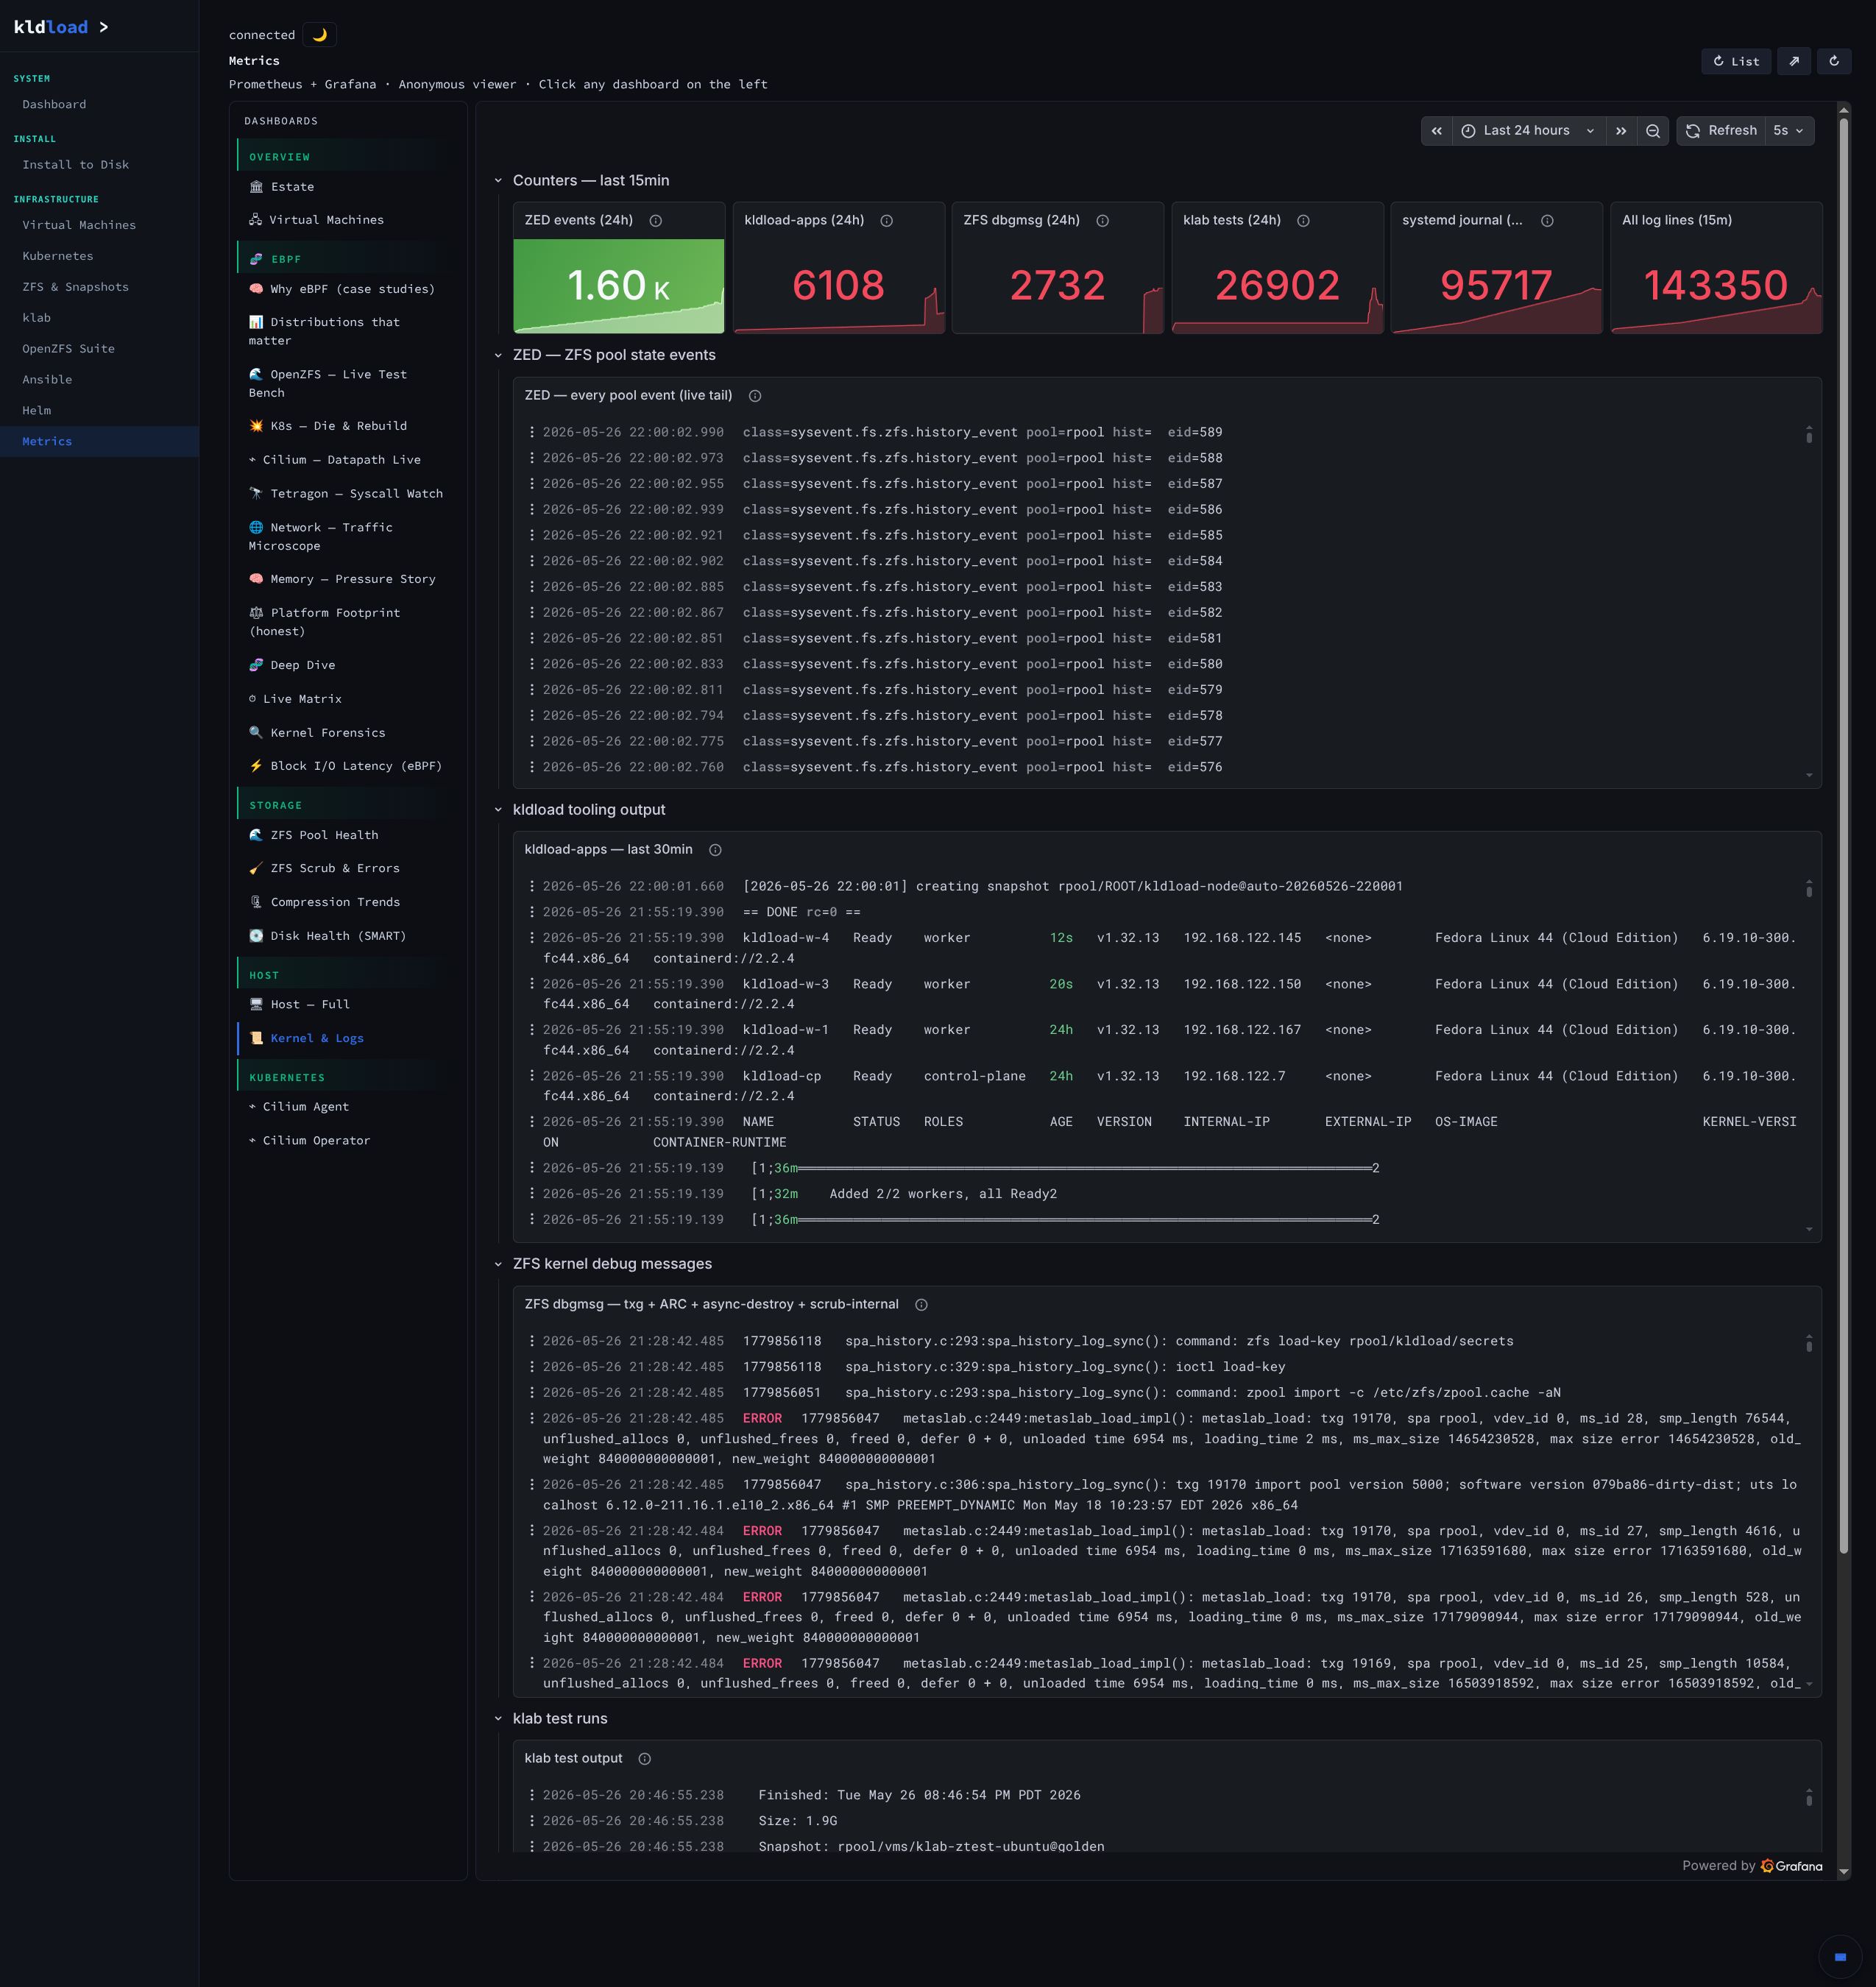
Grafana, Prometheus, Loki, promtail, node_exporter, libvirt-exporter, process-exporter, smartctl_exporter, zfs_exporter, ebpf_exporter, klab-exporter, Cilium+Hubble metrics, Tetragon, kubelet — 13 scrape jobs, 25 targets, all up, all started by systemd before sshd opened a port. You can’t watch a boot from a dashboard that wasn’t running during the boot. That’s why every IaC-built system loses the first sixty seconds of its own existence. Here, every metric you see was collected by a stack that booted with the machine. No agent install step, no reconciliation loop, no waiting for cloud-init to finish writing files.
The biggest section on this page, because there’s genuinely the most to look at
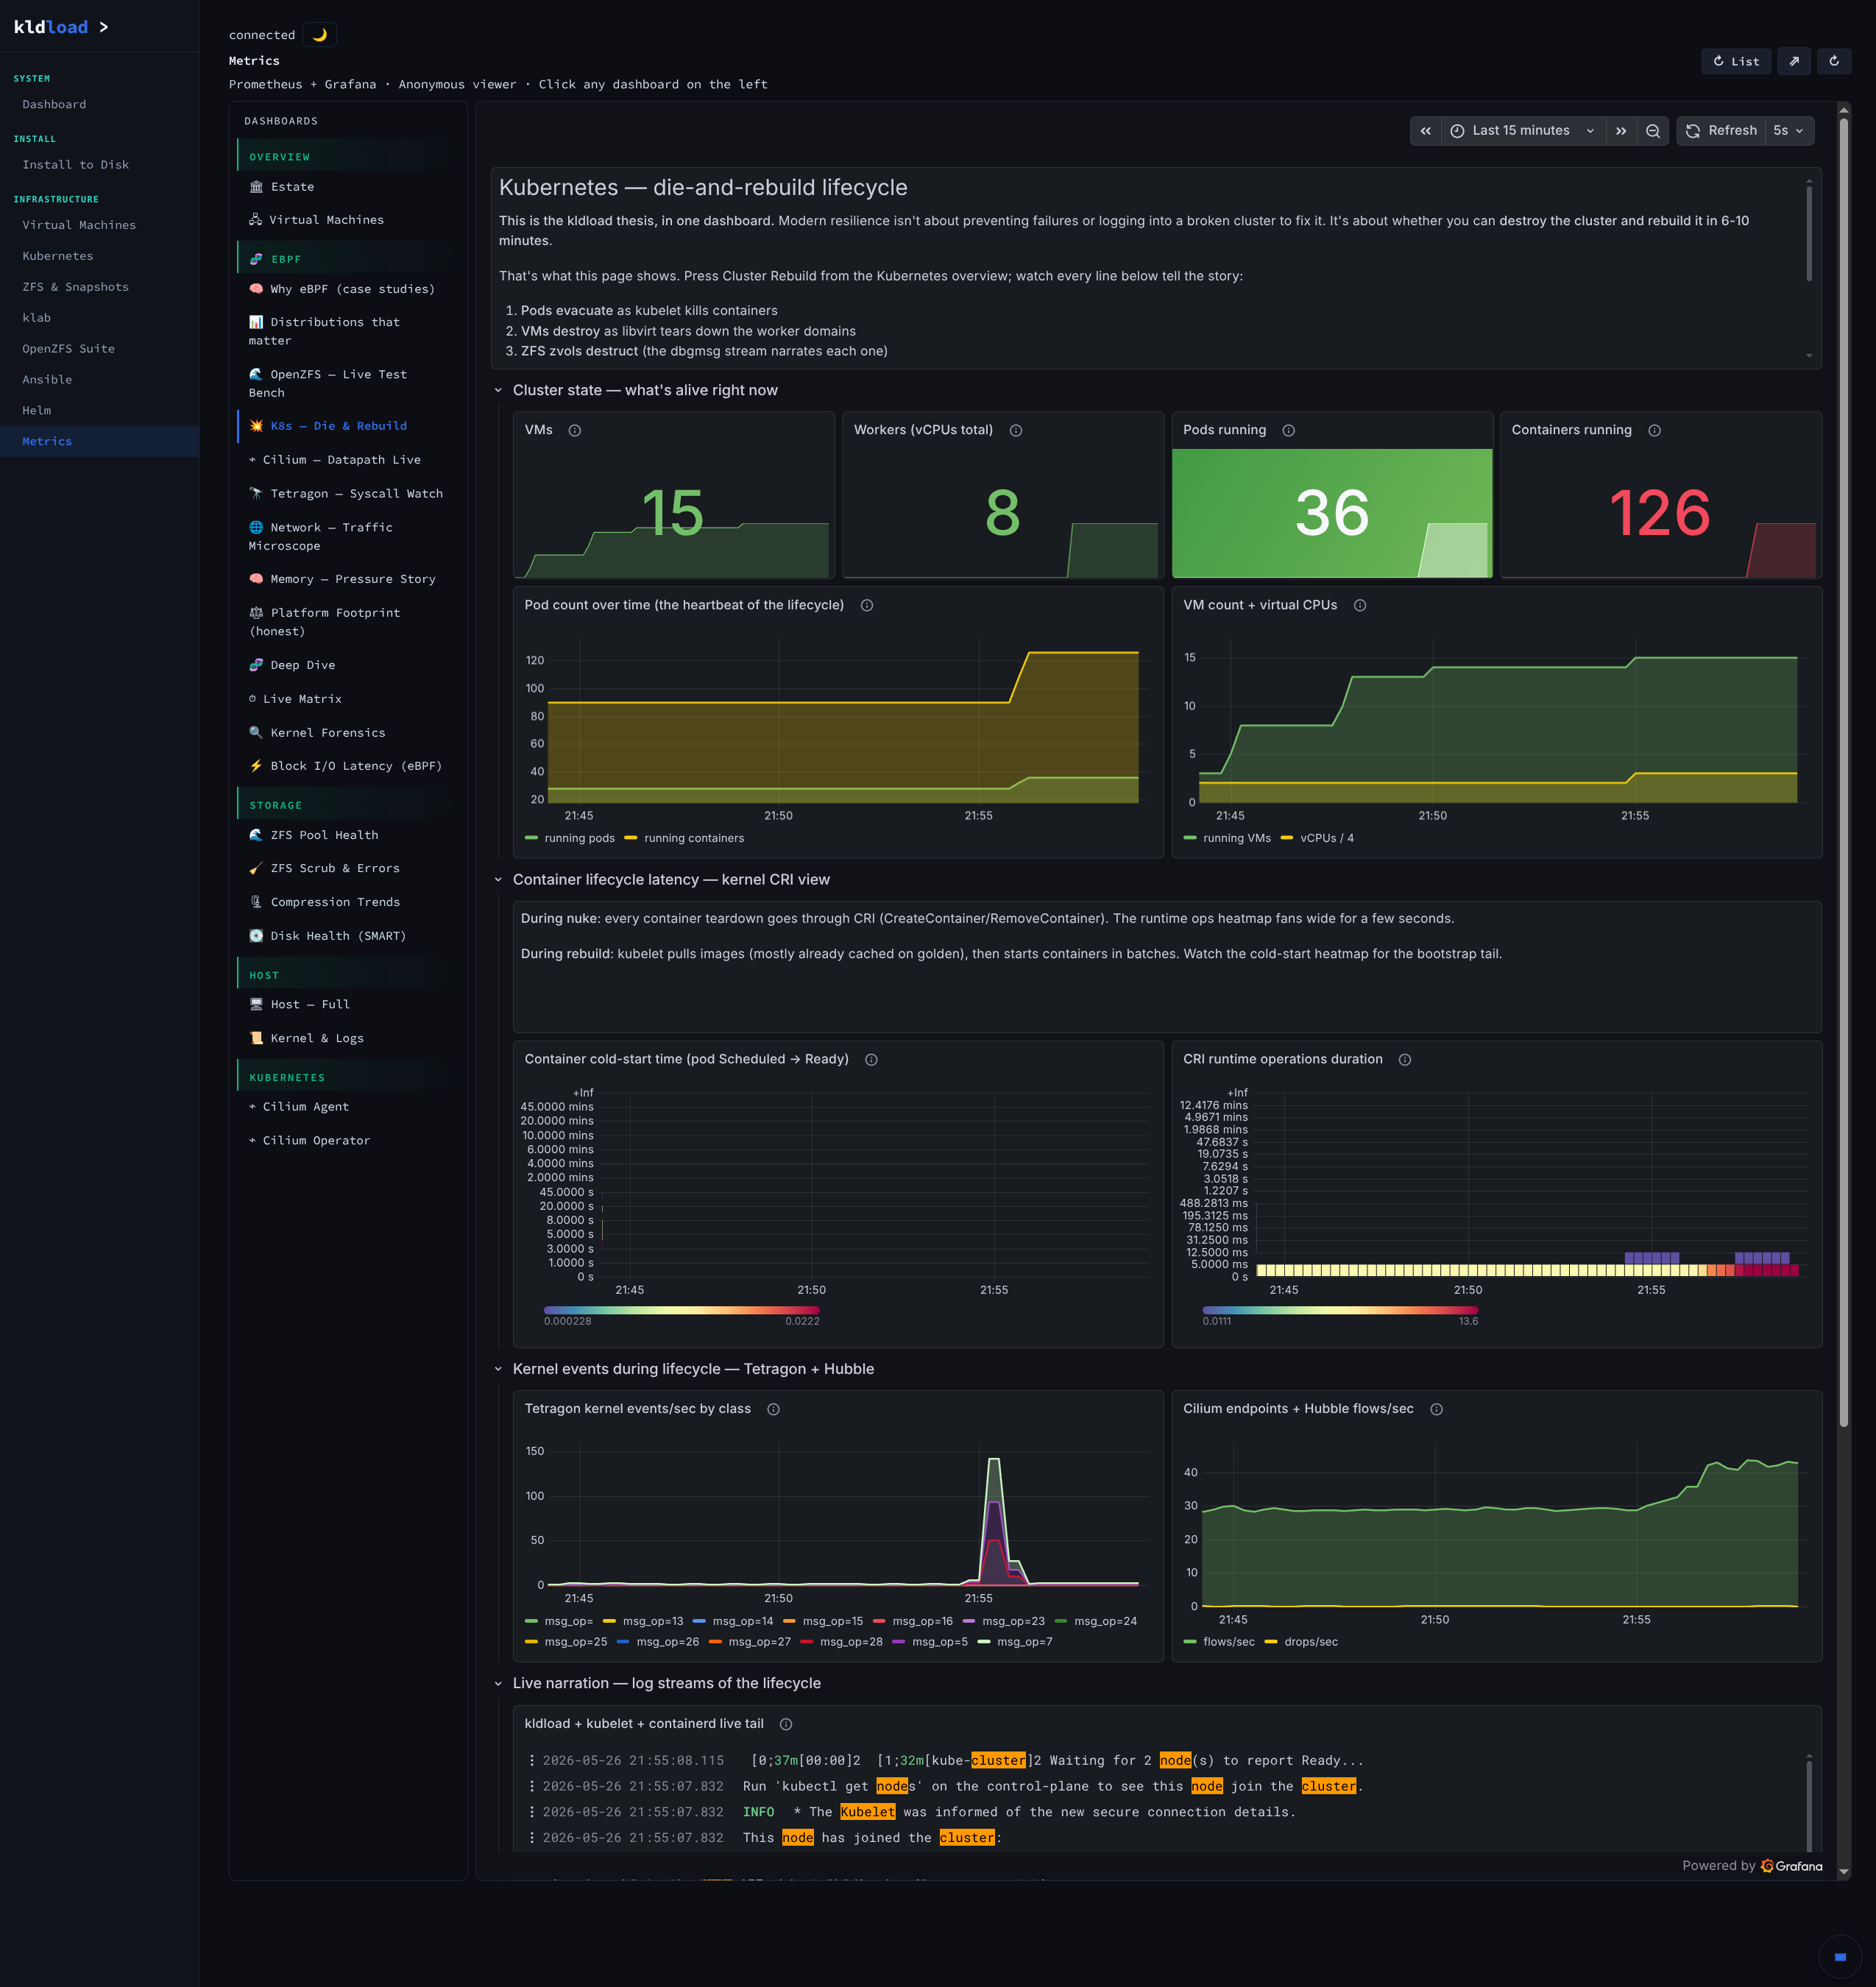
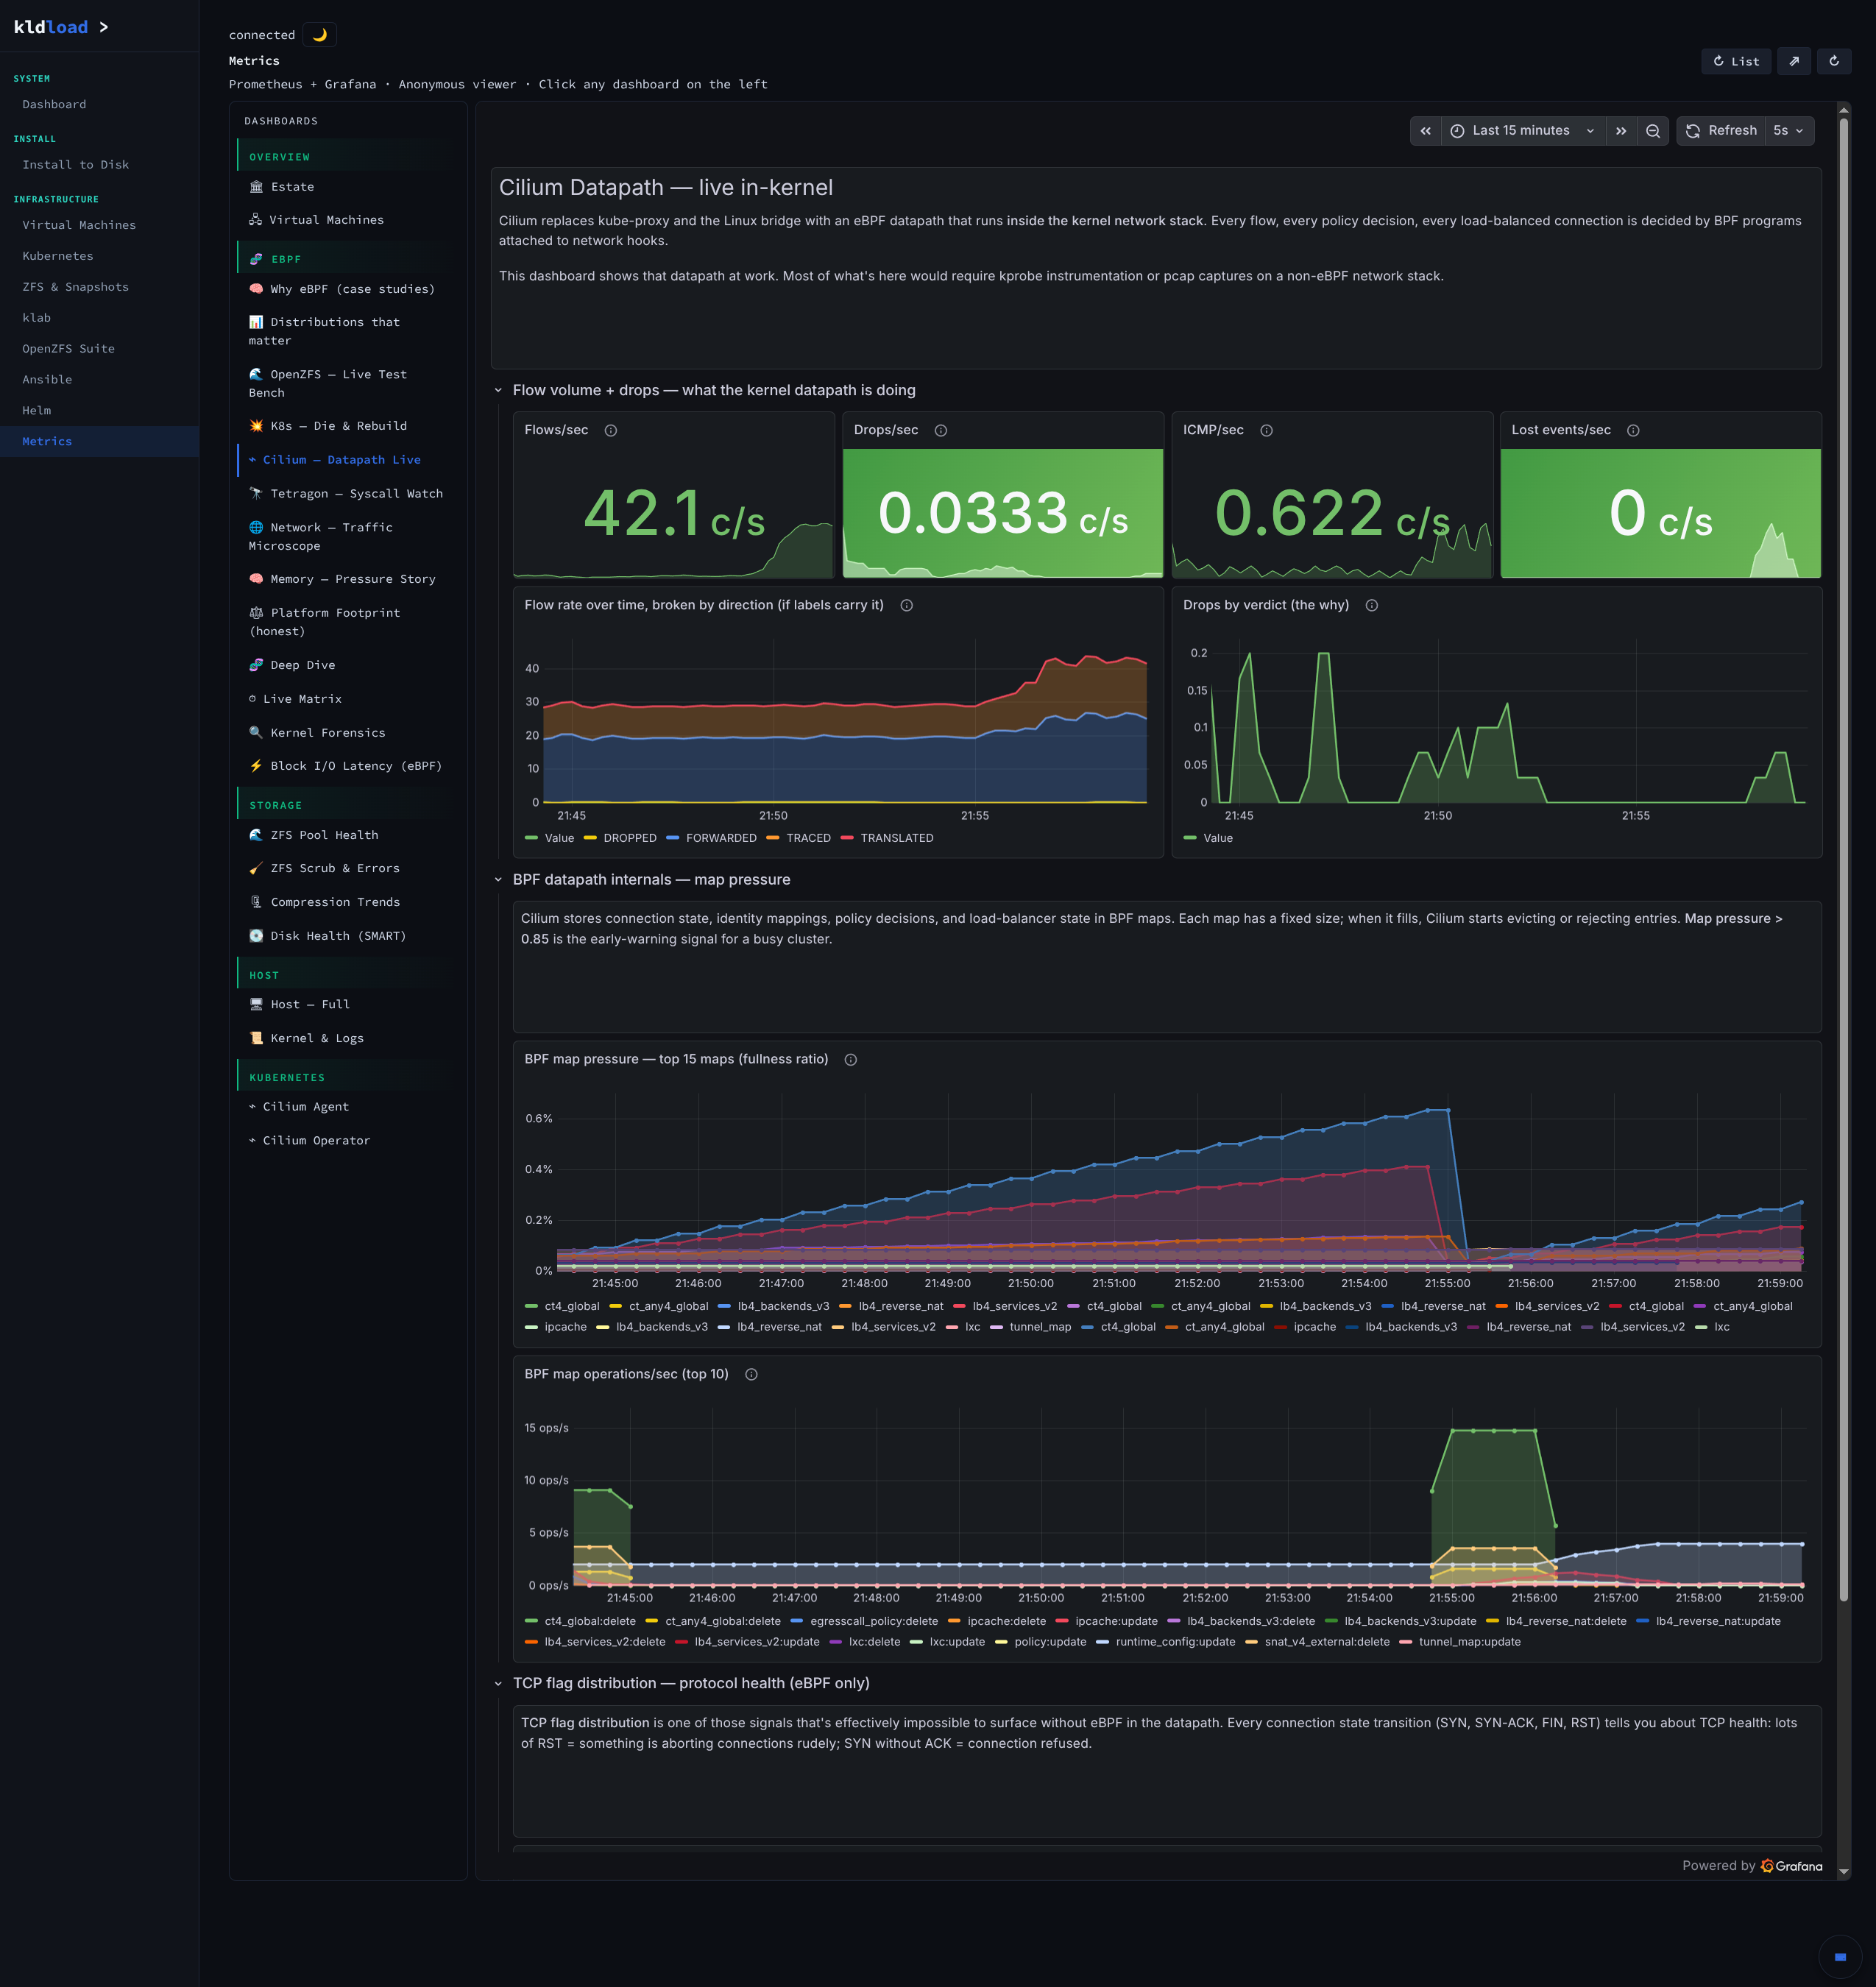
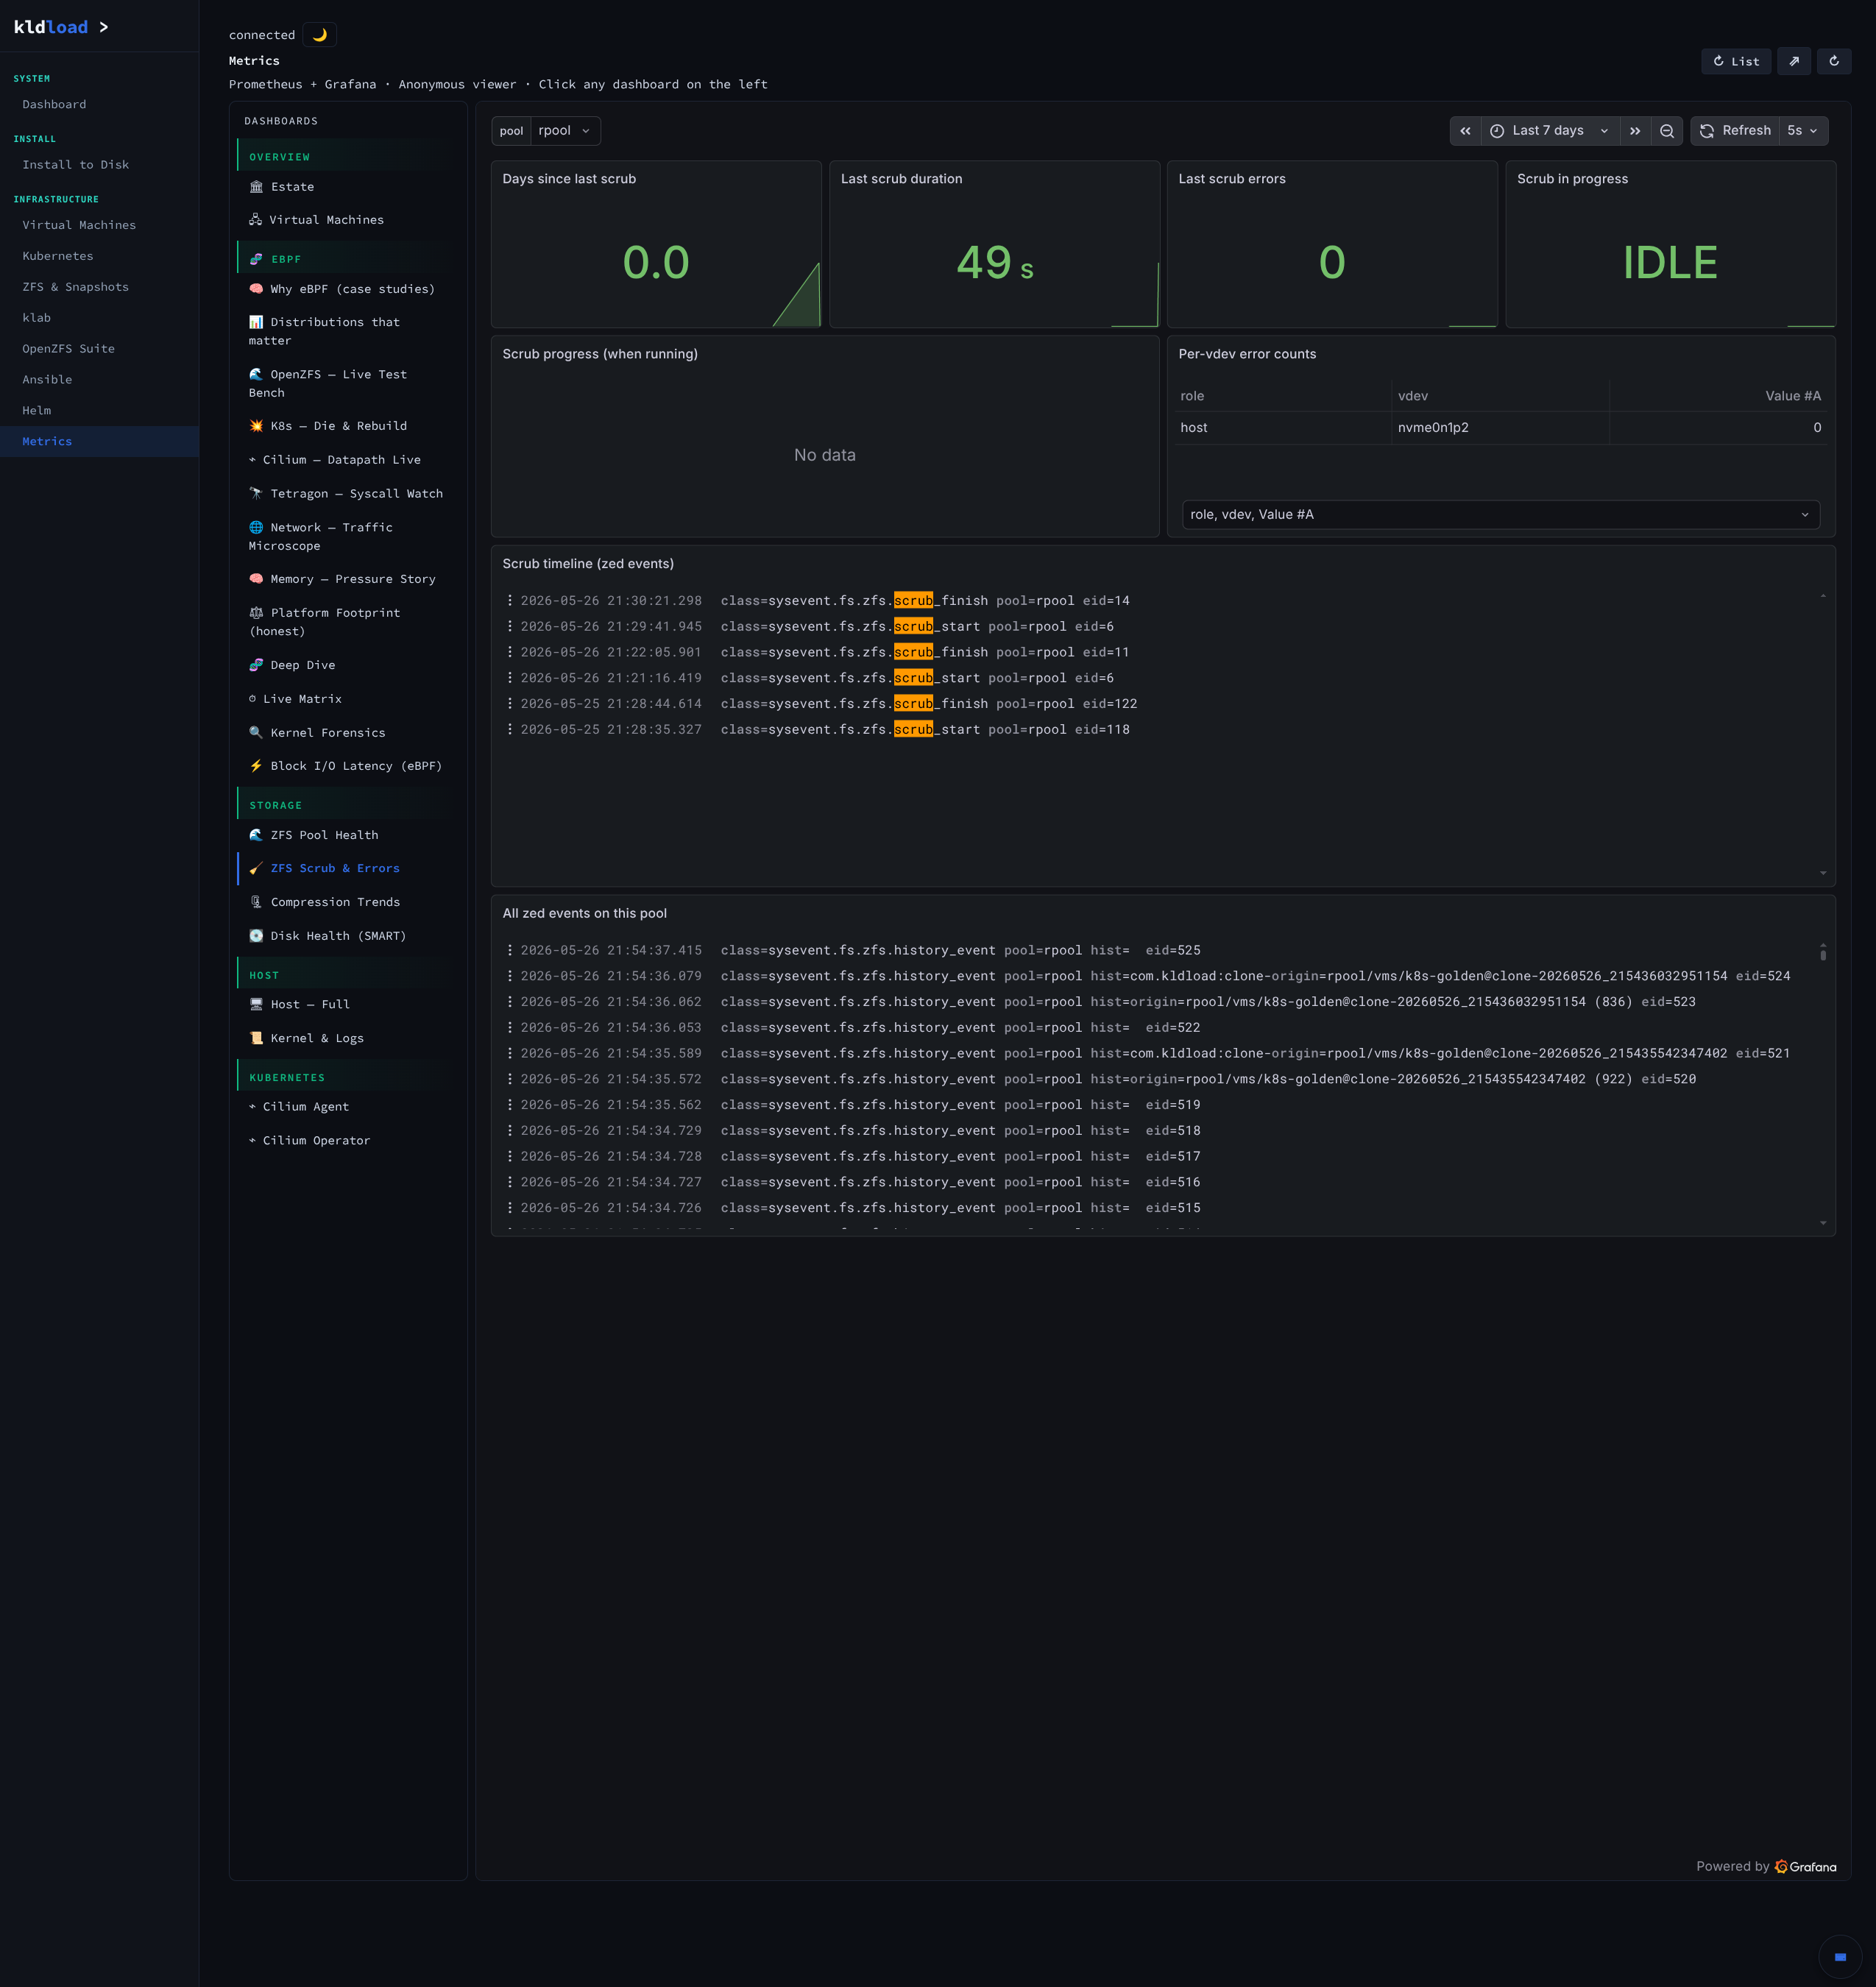
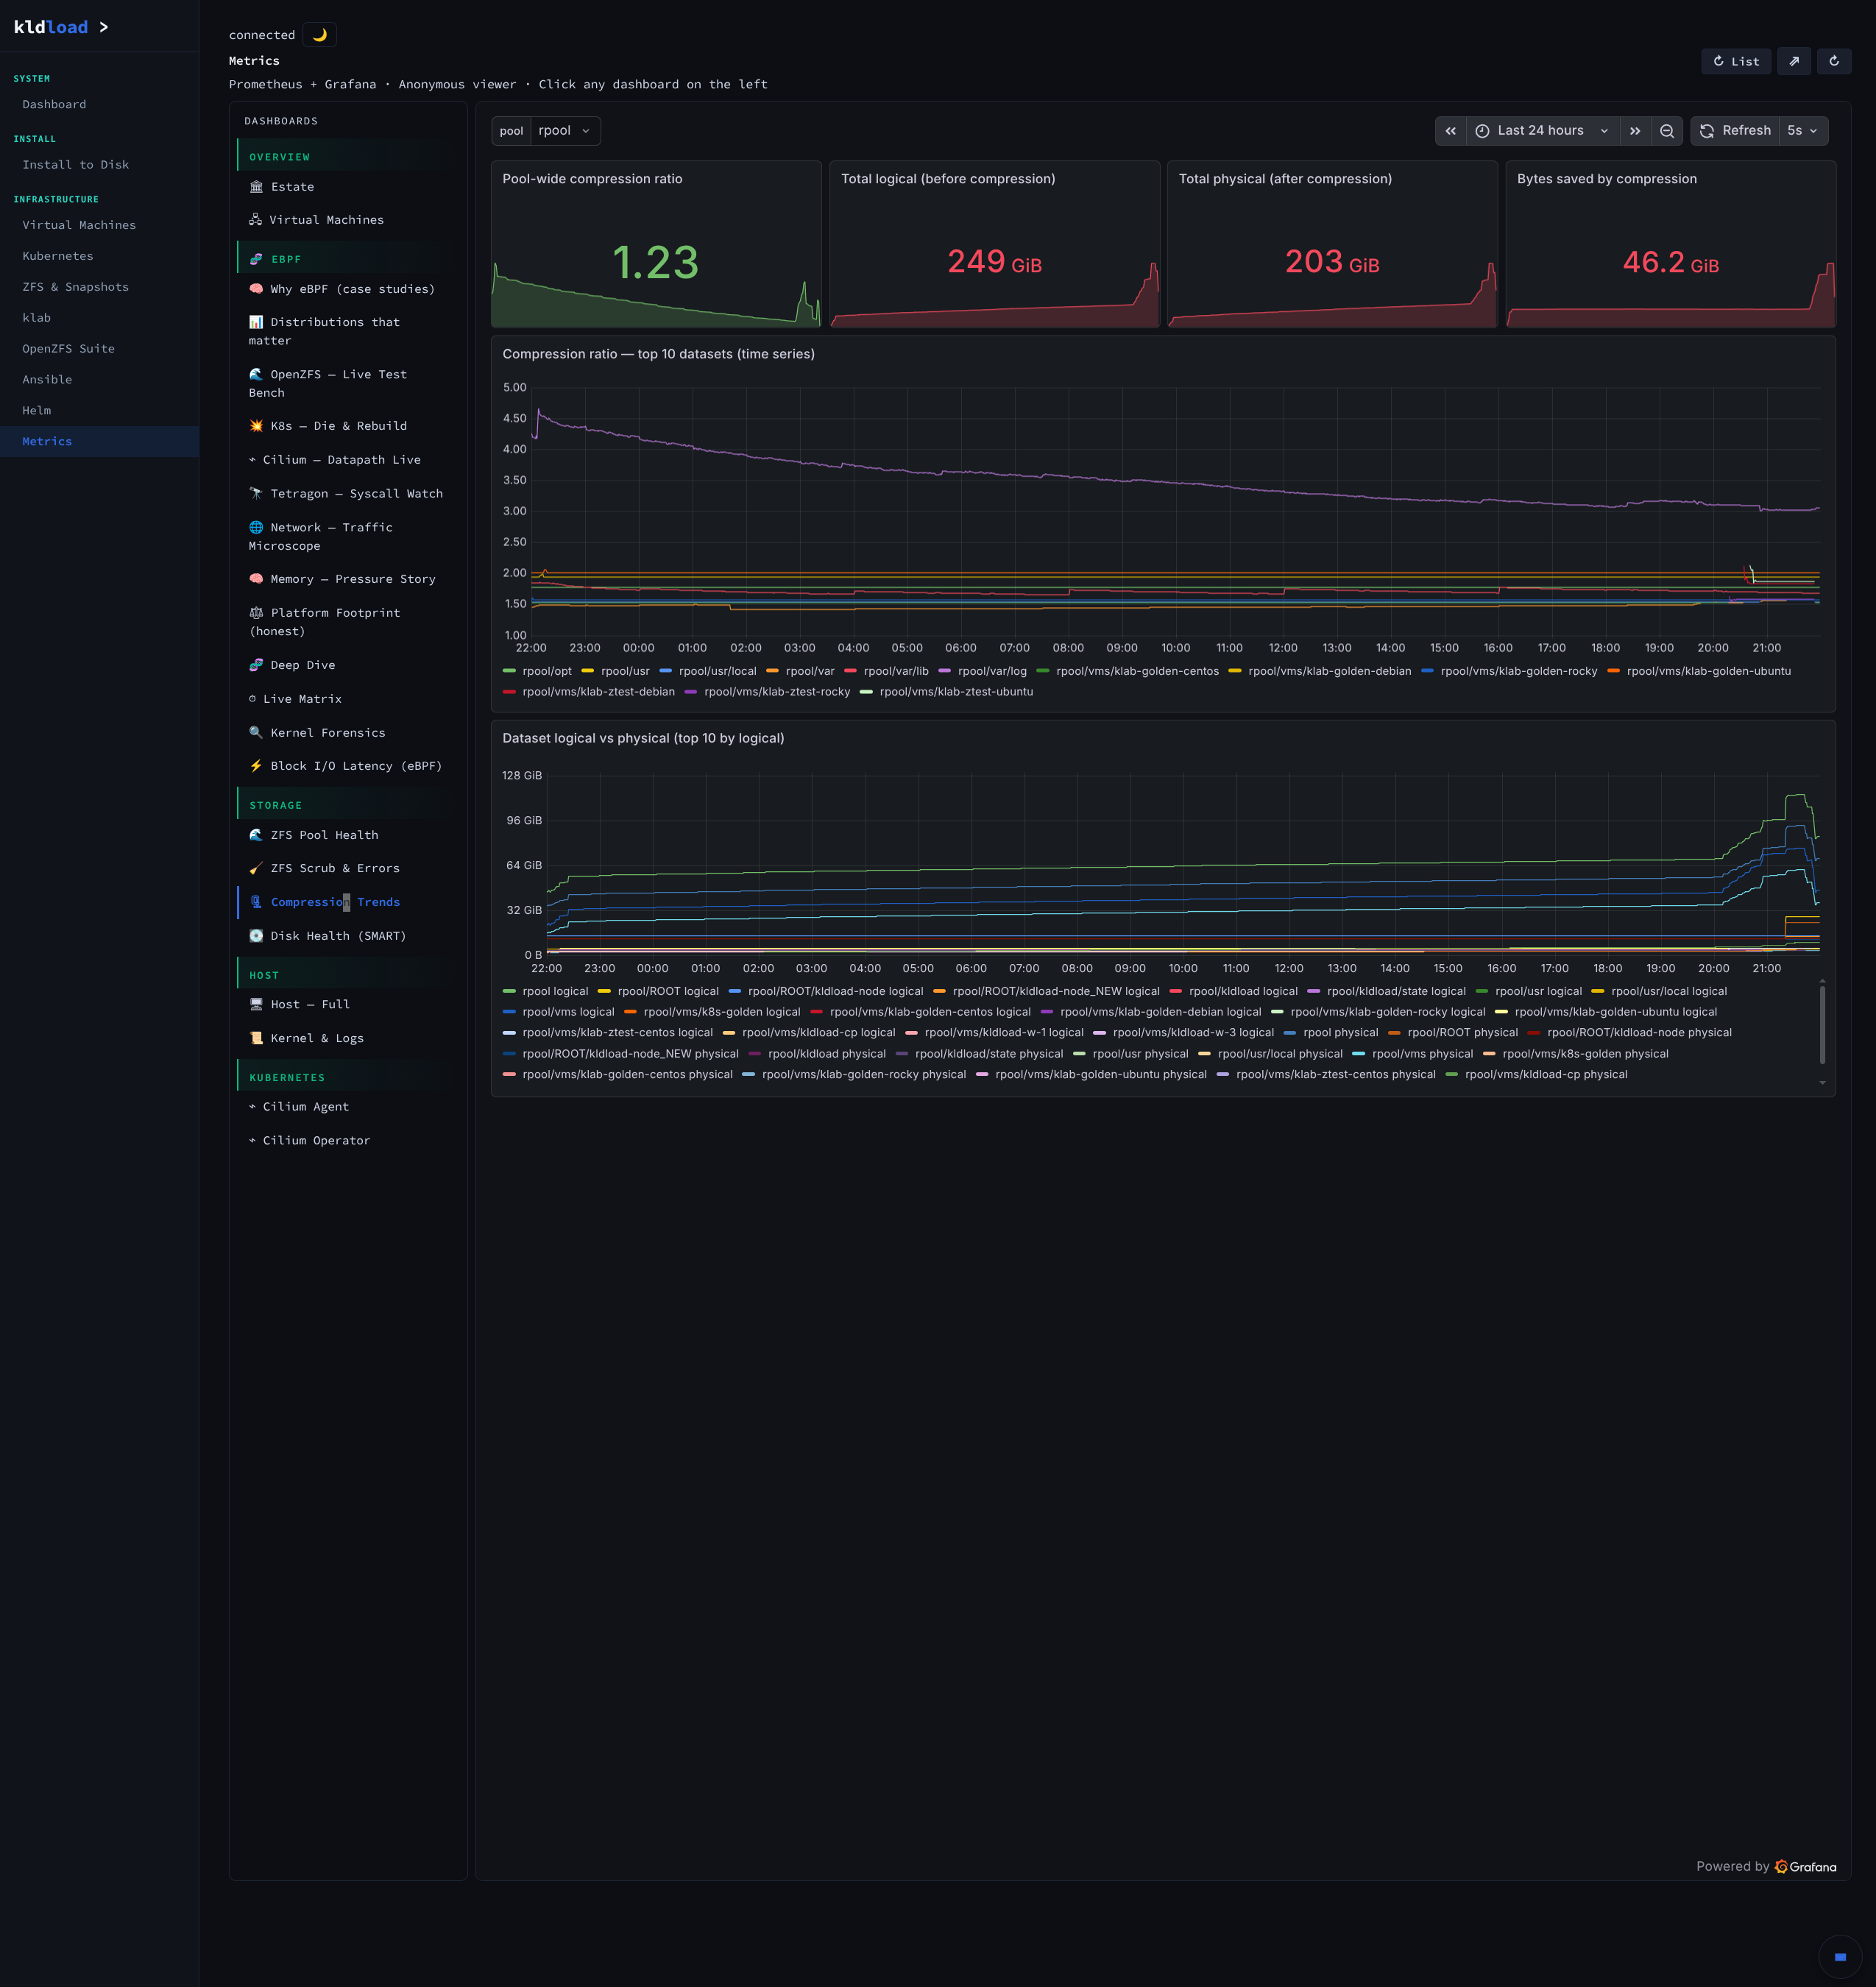
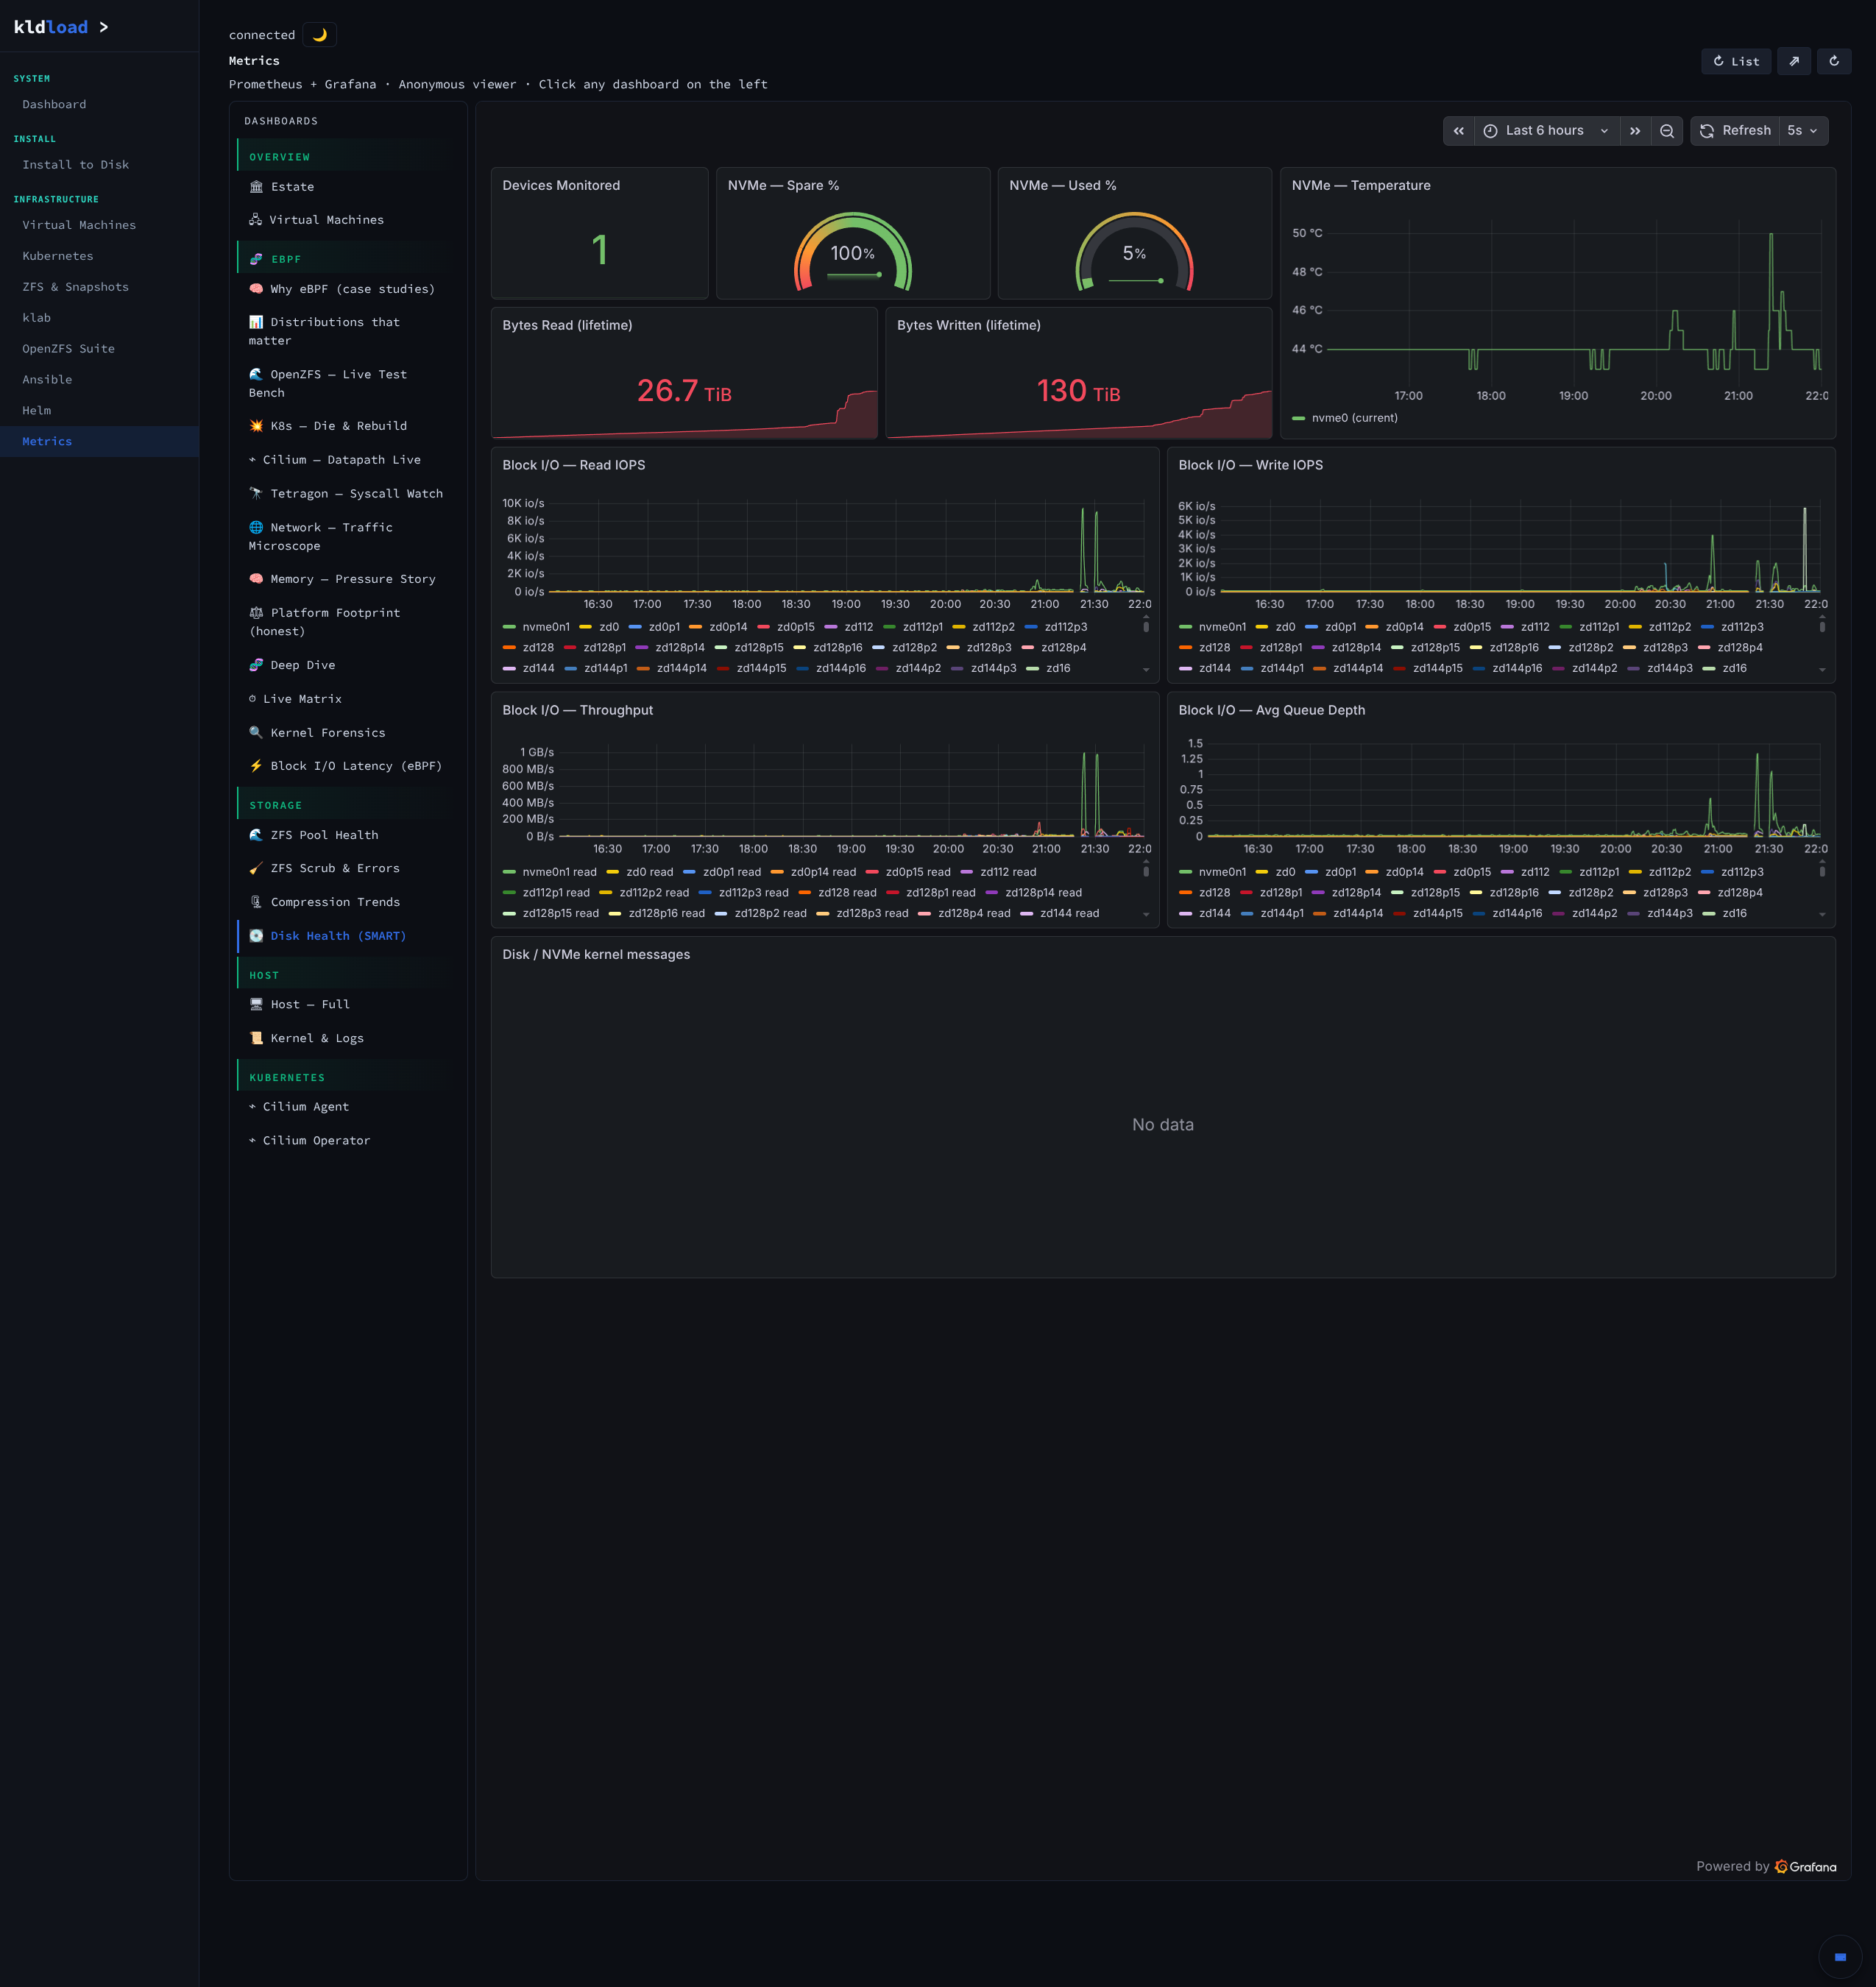
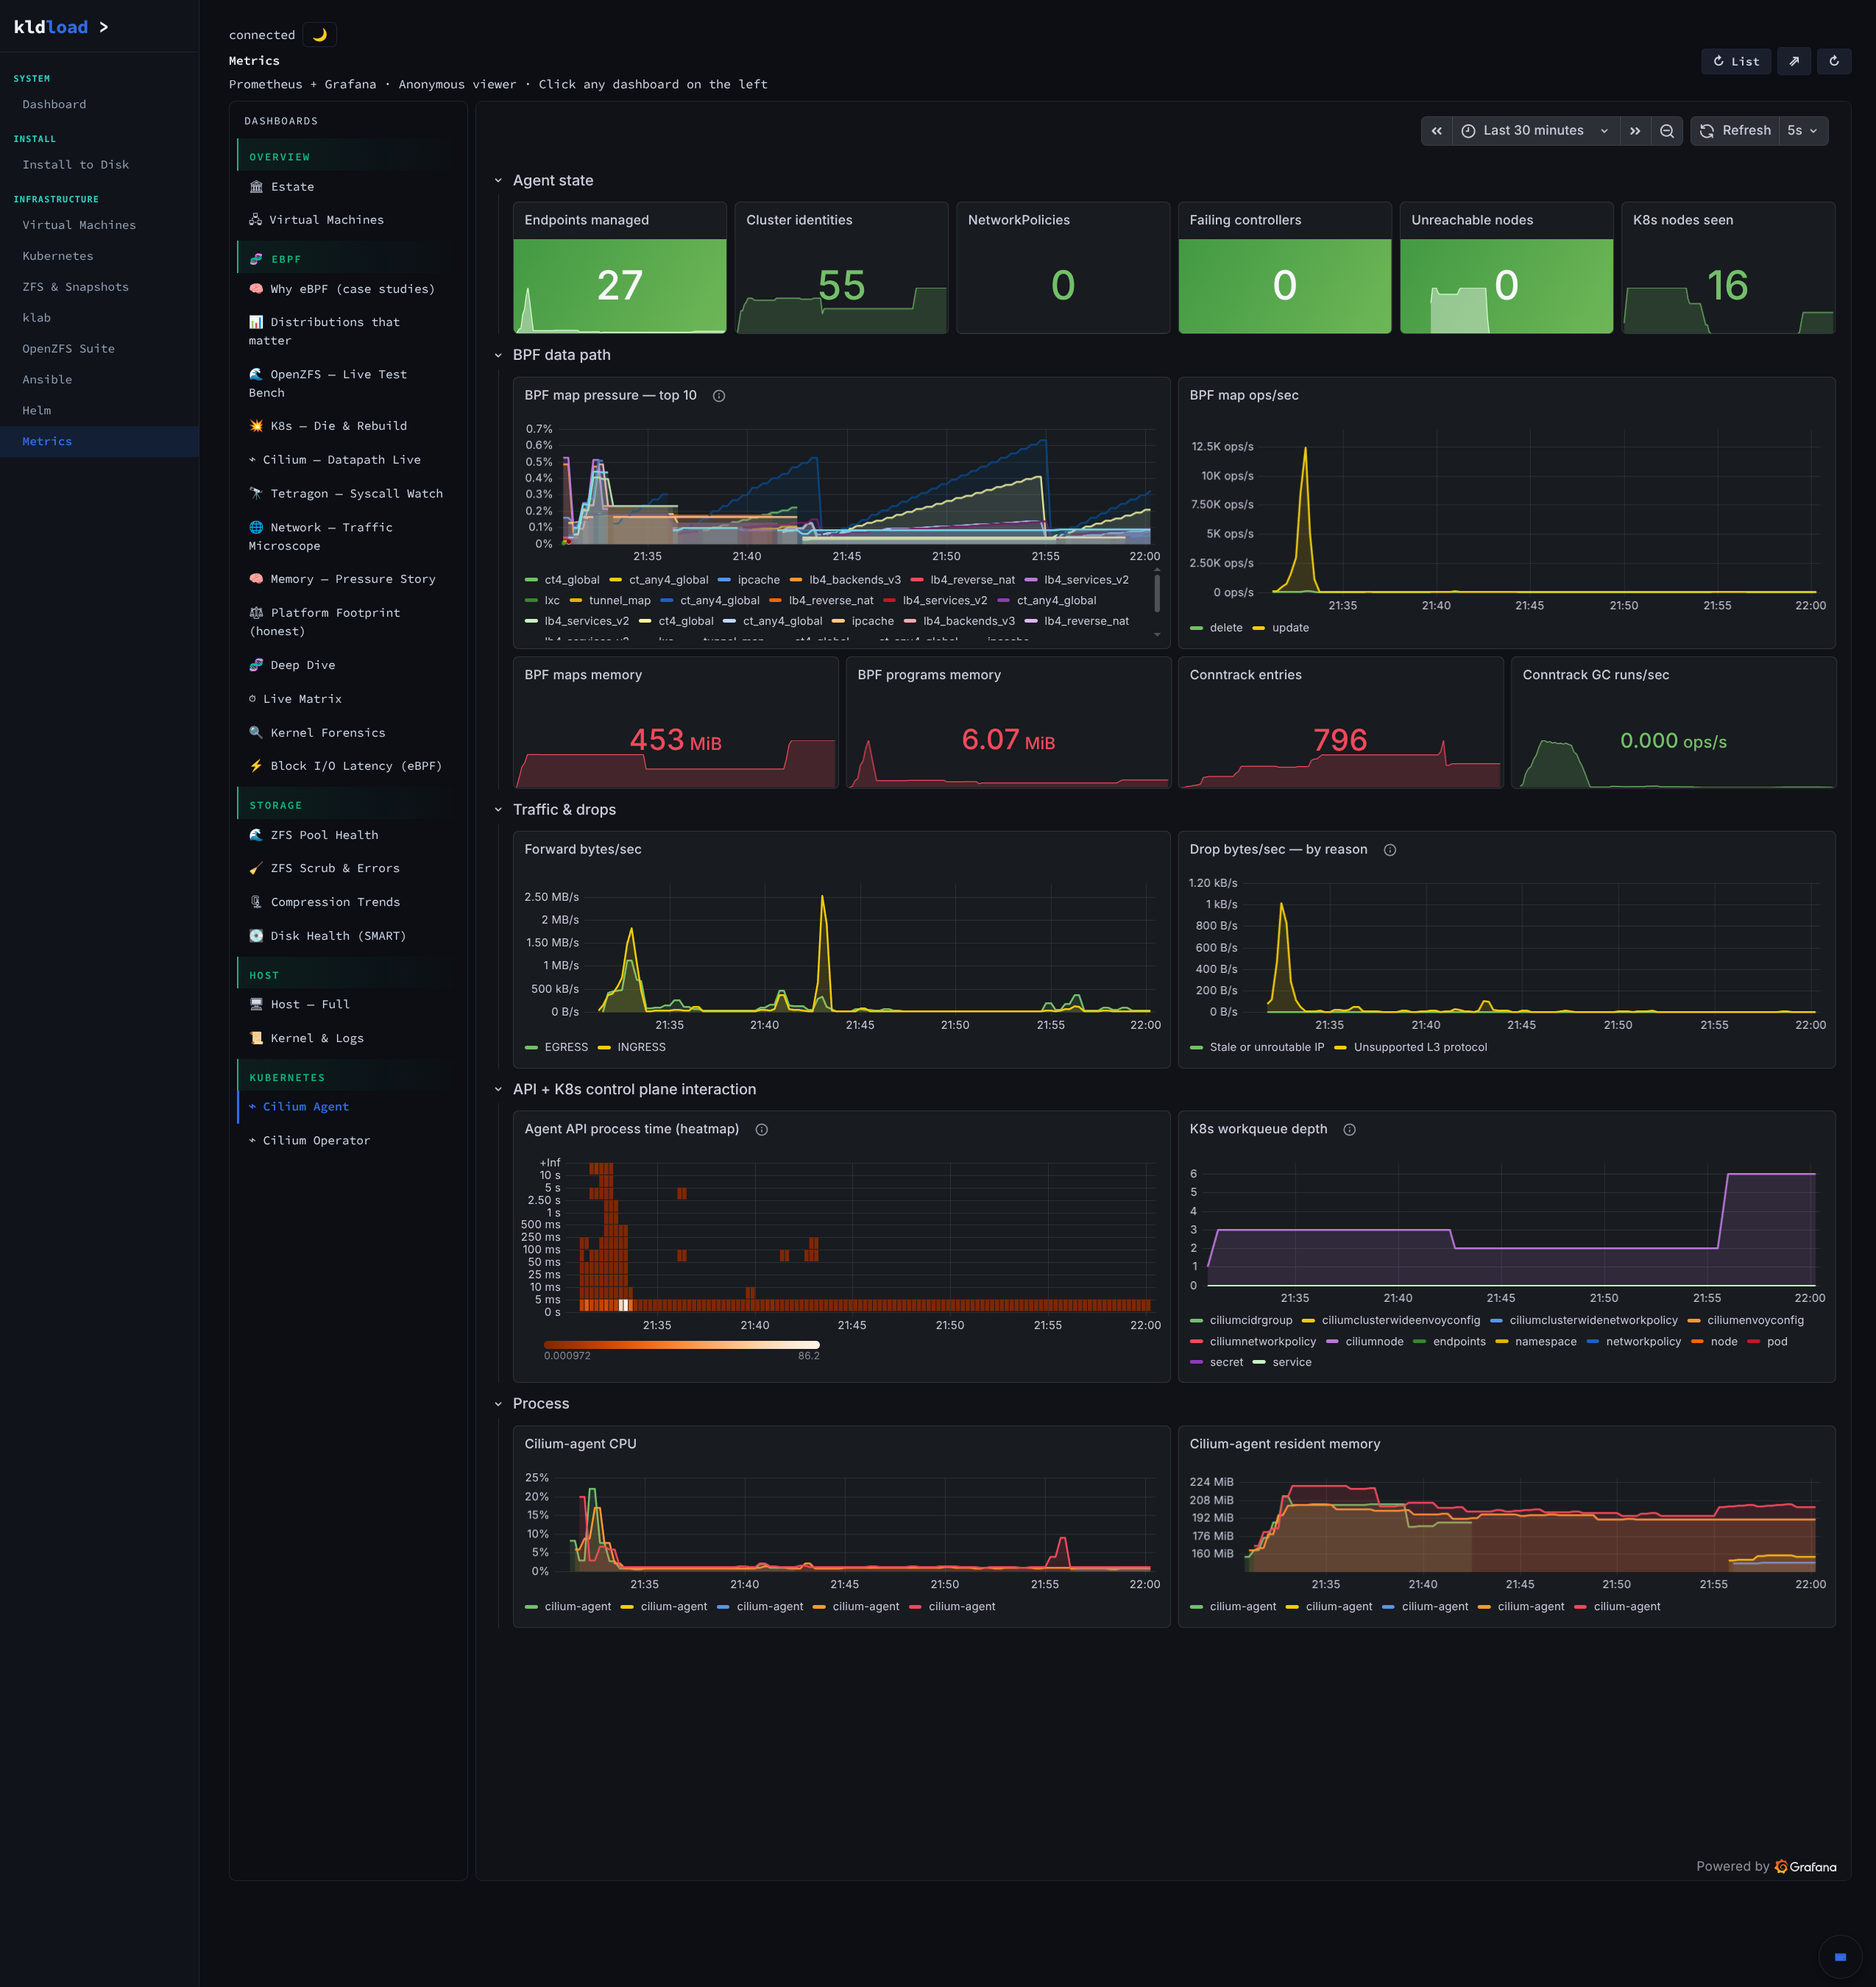
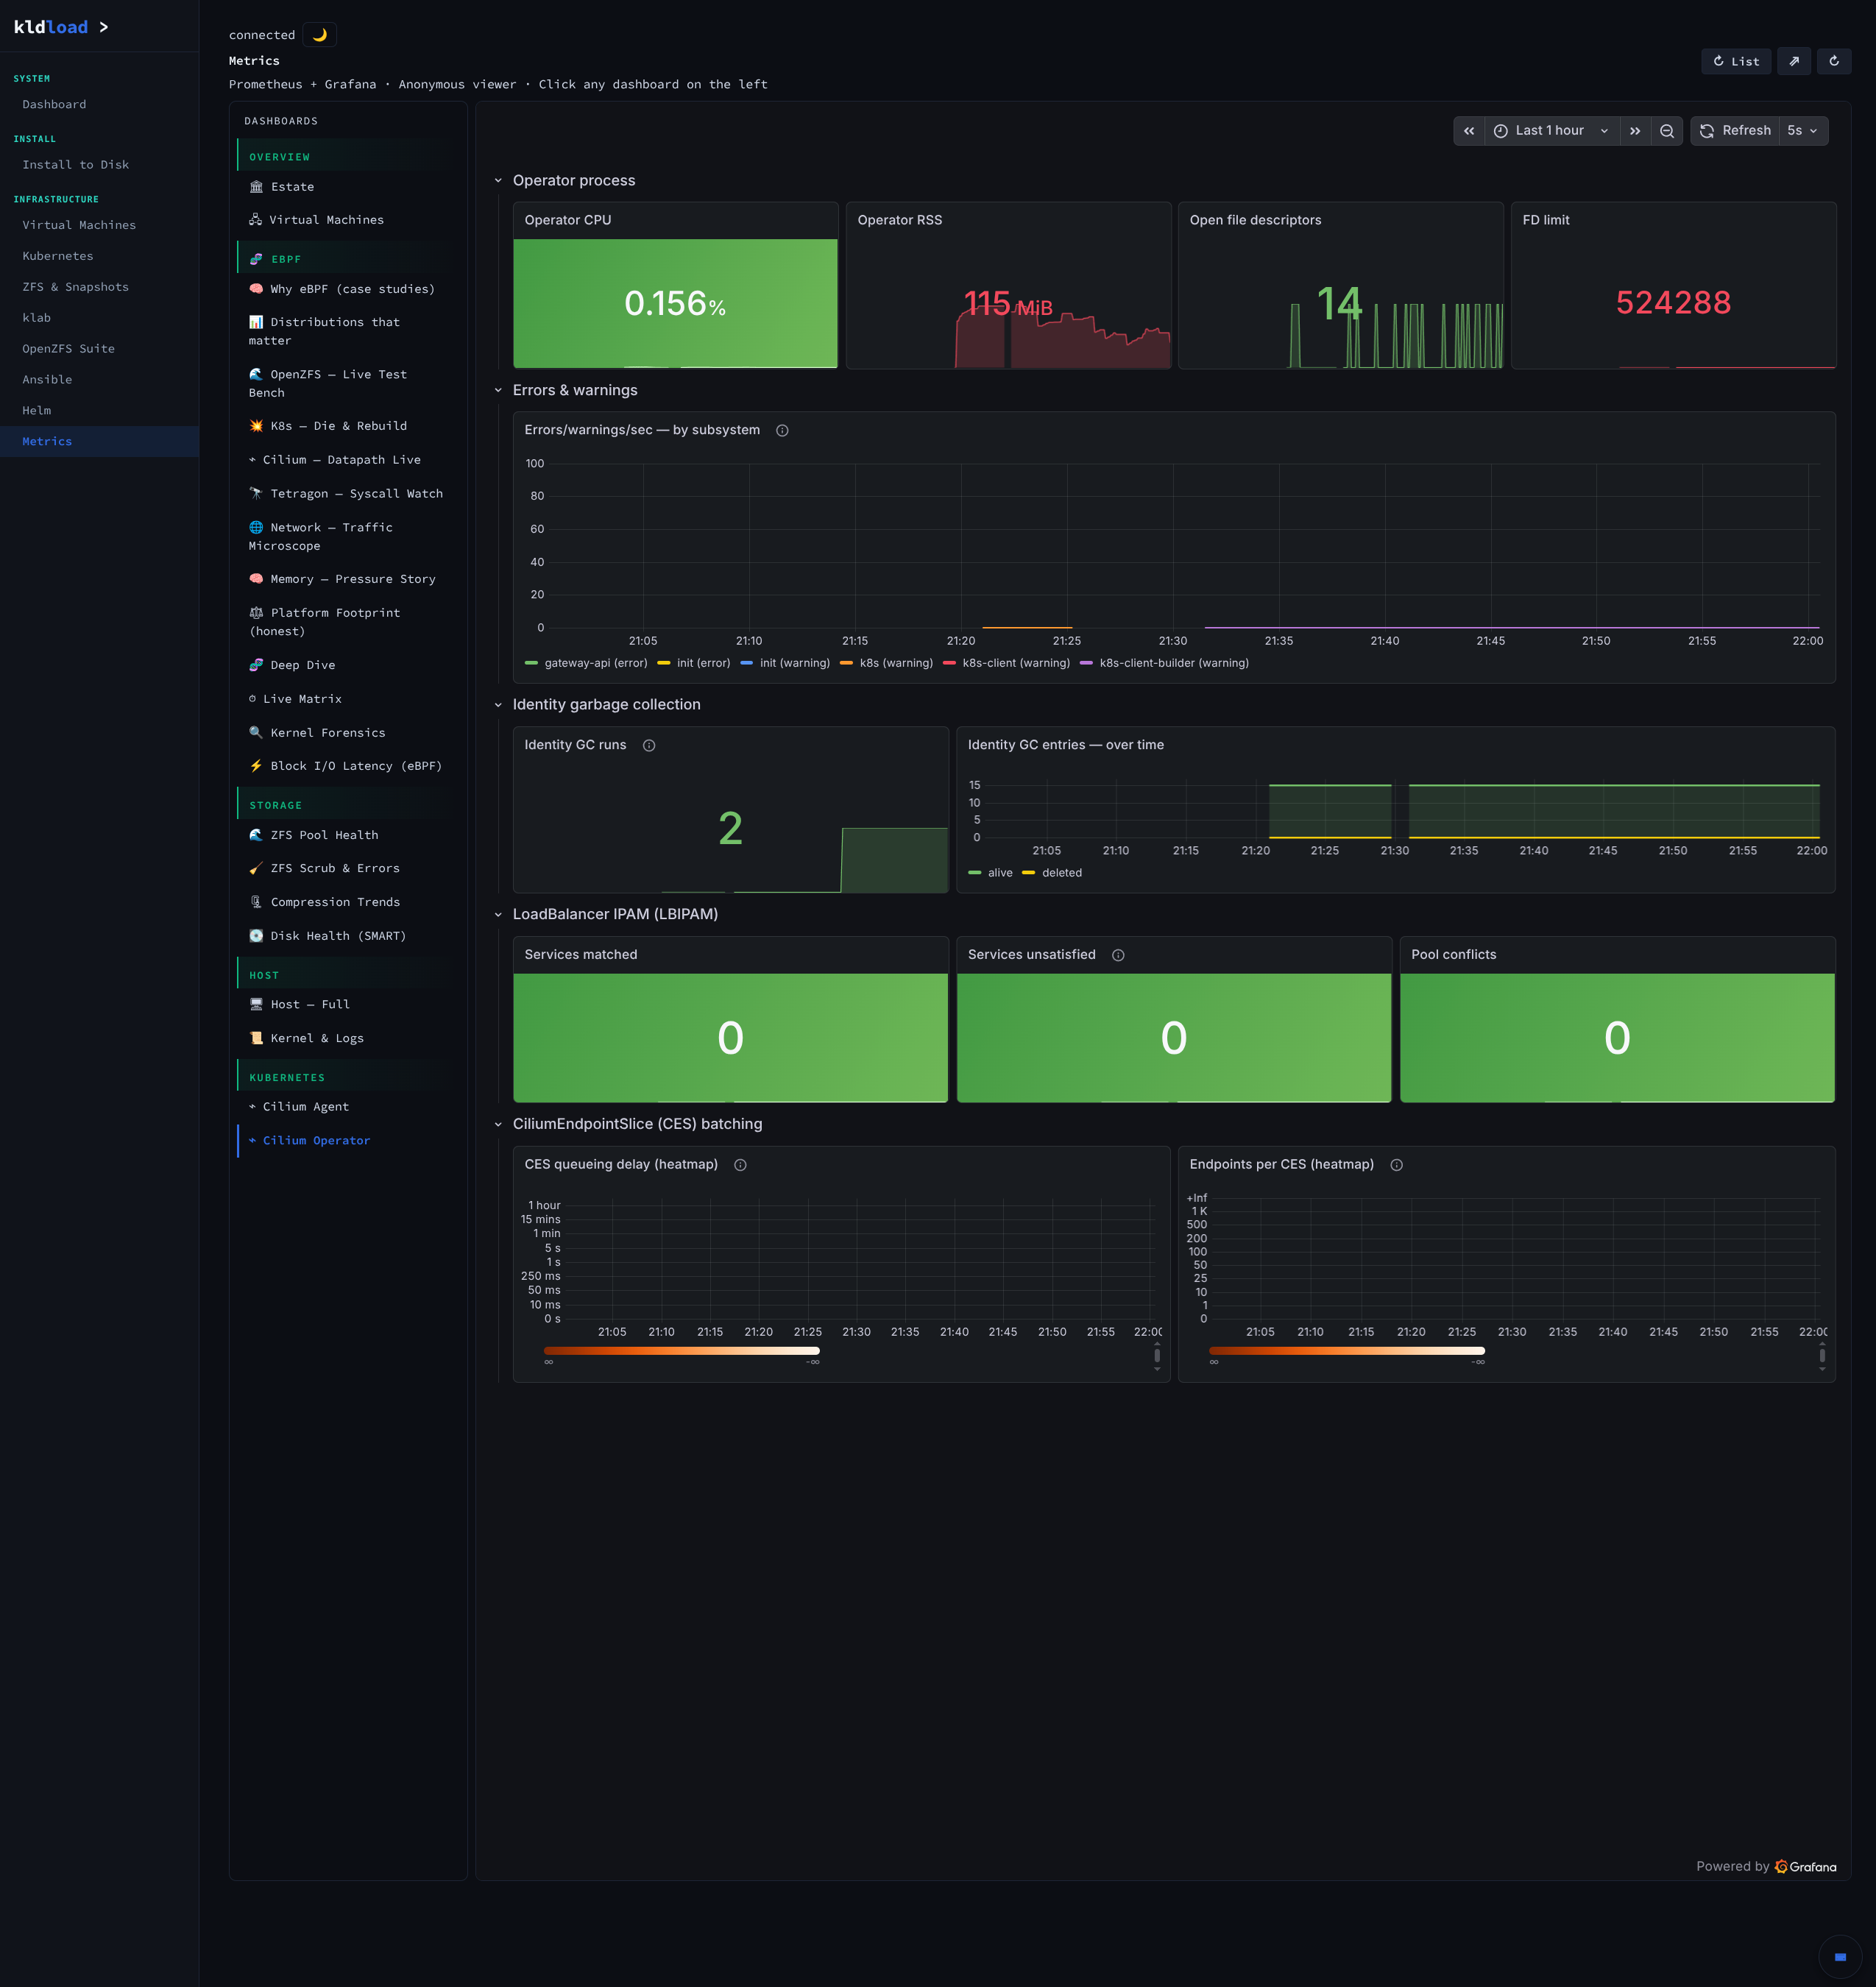
23 dashboards: fleet view, per-VM detail, eBPF case studies, the entire Cilium datapath narration, Tetragon process events, ZFS pool health + ARC behavior + txg sync, boot lifecycle, block-IO latency from the kernel, service-to-service latency heatmaps, drive SMART, Loki + promtail, and the “honest accounting” dashboard that shows how much the observability stack itself costs. The thing every vendor hides; we ship it.